Are You Paying for Software Nobody Uses? How to Audit Your Tech Stack with Employee Productivity Data
The Hidden Cost of Underused Software
Software spending is one of the most significant operational expenses in a modern organization, and one of the least scrutinized. Most procurement decisions start with good intentions: a tool gets evaluated, justified, and purchased. A rollout happens, initial adoption varies, and over time, actual usage often bears little resemblance to what was projected at the time of the contract signing.
The result is a quiet but expensive problem: licenses are renewed on autopilot, seats go unused, and leadership has no reliable data to challenge the renewal spend. All because no one has been consistently tracking whether employees are actually engaging with the tool in a meaningful way.
This pattern plays out across organizations of every size and industry. The rollout happens, training sessions are held, and then usage quietly drops off while the invoices keep coming.
The problem is not always visible from the surface. A tool can appear active in a vendor dashboard because users log in occasionally, but the organization's actual return on that investment is minimal. Without deeper visibility into how tools are used day-to-day, leaders lack the data they need to make confident renewal decisions or to intervene before the waste compounds.
Why Traditional Audits Miss the Real Picture
Most IT teams have some mechanism for reviewing software spend, whether that is a periodic license review, a vendor-supplied usage report, or a manual survey pushed to department heads at budget time. These approaches have real limitations that are worth understanding before assuming they are sufficient.
Vendor-provided usage reports are often designed to protect the renewal relationship, not to help you reduce your seat count. They typically show whether someone logged in during a period, not whether they engaged meaningfully with the tool or used the features that justified the purchase in the first place. A user who opens an application twice a month appears as "active" on most vendor dashboards.
Manual surveys depend on a manager’s memory and self-reporting, which tends to be optimistic and inconsistent. Managers often do not know which tools their team members are actively using versus those they are technically licensed to use. And by the time a formal audit is triggered, the renewal conversation has usually already started, leaving little room for leverage or reconsideration.
What most organizations are missing is a continuous, objective source of tool usage data that sits outside the vendor relationship and reflects what employees are actually doing day-to-day across their entire tech stack.
What Technology Adoption Data Actually Shows
Productivity intelligence platforms that integrate directly with your existing business applications can surface technology adoption data without any additional monitoring setup. Because much of the data comes from direct API integrations rather than screen monitoring, the resulting view is more nuanced than a standard login record.
Rather than seeing only whether an employee opened a tool, leaders can see module-level engagement. In a staffing agency context, for example, that means distinguishing between a recruiter who logs notes, updates leads, and submits candidates in their ATS and one who is technically active in the system but engaging with only a fraction of its functionality. Those are very different productivity pictures, and they lead to very different decisions.
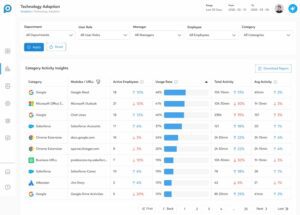
The core metrics that technology adoption data can surface include the number of active employees using each tool within a given time period; an adoption rate showing what percentage of the filtered team is engaging with the tool, total activity volume for context on engagement depth, and per-employee averages that make outliers easy to identify. Trend indicators show whether adoption is growing, holding steady, or declining, which is often more important than the current snapshot alone.
Filters by department, user role, manager, and individual employee allow leaders to move from an org-wide view to a targeted one in seconds. That granularity is what makes the data actionable rather than merely informative.
How to Use Adoption Insights to Cut License Costs
When adoption data is filtered, patterns that would otherwise remain hidden become visible quickly and consistently.
A department with 50 employees that shows only 8 active users on a collaboration platform is a clear signal. A license category where average activity has declined by 30% over the past 30 days is worth investigating before the next renewal. An employee with no recorded activity on a tool that the entire team is expected to use is a conversation worth initiating.
The practical application looks like this: before a software renewal comes up, pull the adoption data for that tool category. Filter it by the teams most expected to use it. Look at the adoption rate, trend direction, and number of inactive users. If the data shows meaningful underutilization, leadership has a factual, documented basis to negotiate fewer seats, delay a renewal cycle, or eliminate the license entirely.
This is the kind of evidence that procurement and IT leaders have historically had to build manually, if they could build it at all. When these decisions are surfaced automatically through an existing productivity intelligence workflow, the time and effort required to make these decisions drops significantly, and the decisions themselves become much easier to defend internally.
Turning Adoption Gaps Into Employee Coaching Opportunities
Not every underutilization finding calls for a license reduction. Some of the most valuable findings in a technology adoption audit point to a coaching opportunity rather than a procurement one.
When a team lead sees that two or three employees on their team have notably lower adoption of a tool the rest of the group is using effectively, the right response is not always to remove the license. Is the employee struggling with the interface? Did they miss a training session? Have they found a workaround that is less efficient but more familiar? Is there a workflow friction point the manager was never aware of?
Technology adoption data makes it possible to have that conversation with specificity. Instead of a general check-in, the manager can come to the one-on-one with a concrete observation and a genuine question. That tends to surface far better information than a vague check-in, and it tends to lead to an action plan both parties can commit to.
This is where the connection between technology utilization and employee productivity becomes especially clear. Employees who are not fully leveraging available tools are often leaving value on the table, not out of disengagement but because they have not been equipped or encouraged to use those tools effectively. Identifying that gap early is one of the most direct coaching opportunities a manager has.
Where to Start
The first step is making sure you have visibility into the adoption data your organization is already generating. If your team uses a productivity intelligence platform like Prodoscore that is integrated with your core business applications, that data likely already exists. The question is whether it is being surfaced in a way that is actionable.
Start by identifying one or two high-cost software categories in your tech stack, then review the adoption data for those tools. Look at which departments and roles show the highest and lowest engagement. Set a baseline and revisit it at the next logical checkpoint, whether that is a quarterly planning cycle or an upcoming renewal.
Over time, this becomes a standard part of how your organization evaluates its technology investments, not a reactive exercise at contract time, but a proactive and continuous visibility practice that keeps leadership informed, financially disciplined, and positioned to coach their teams more effectively.
Learn more about Prodoscore’s Technology Adoption data and request a demo.