Customer Success Story
Industry
Sales Organization
Report Cohort
Sales Executives: 20
600K+ Data Points
Timeframe:
September 1, 2023 – March 3, 2024
Integrations

Executive Summary
The purpose of this study was to identify correlations between Sales Executive performance and productivity to understand how various factors affect overall efficiency and productivity, providing a foundation for informed decision-making and strategic planning.
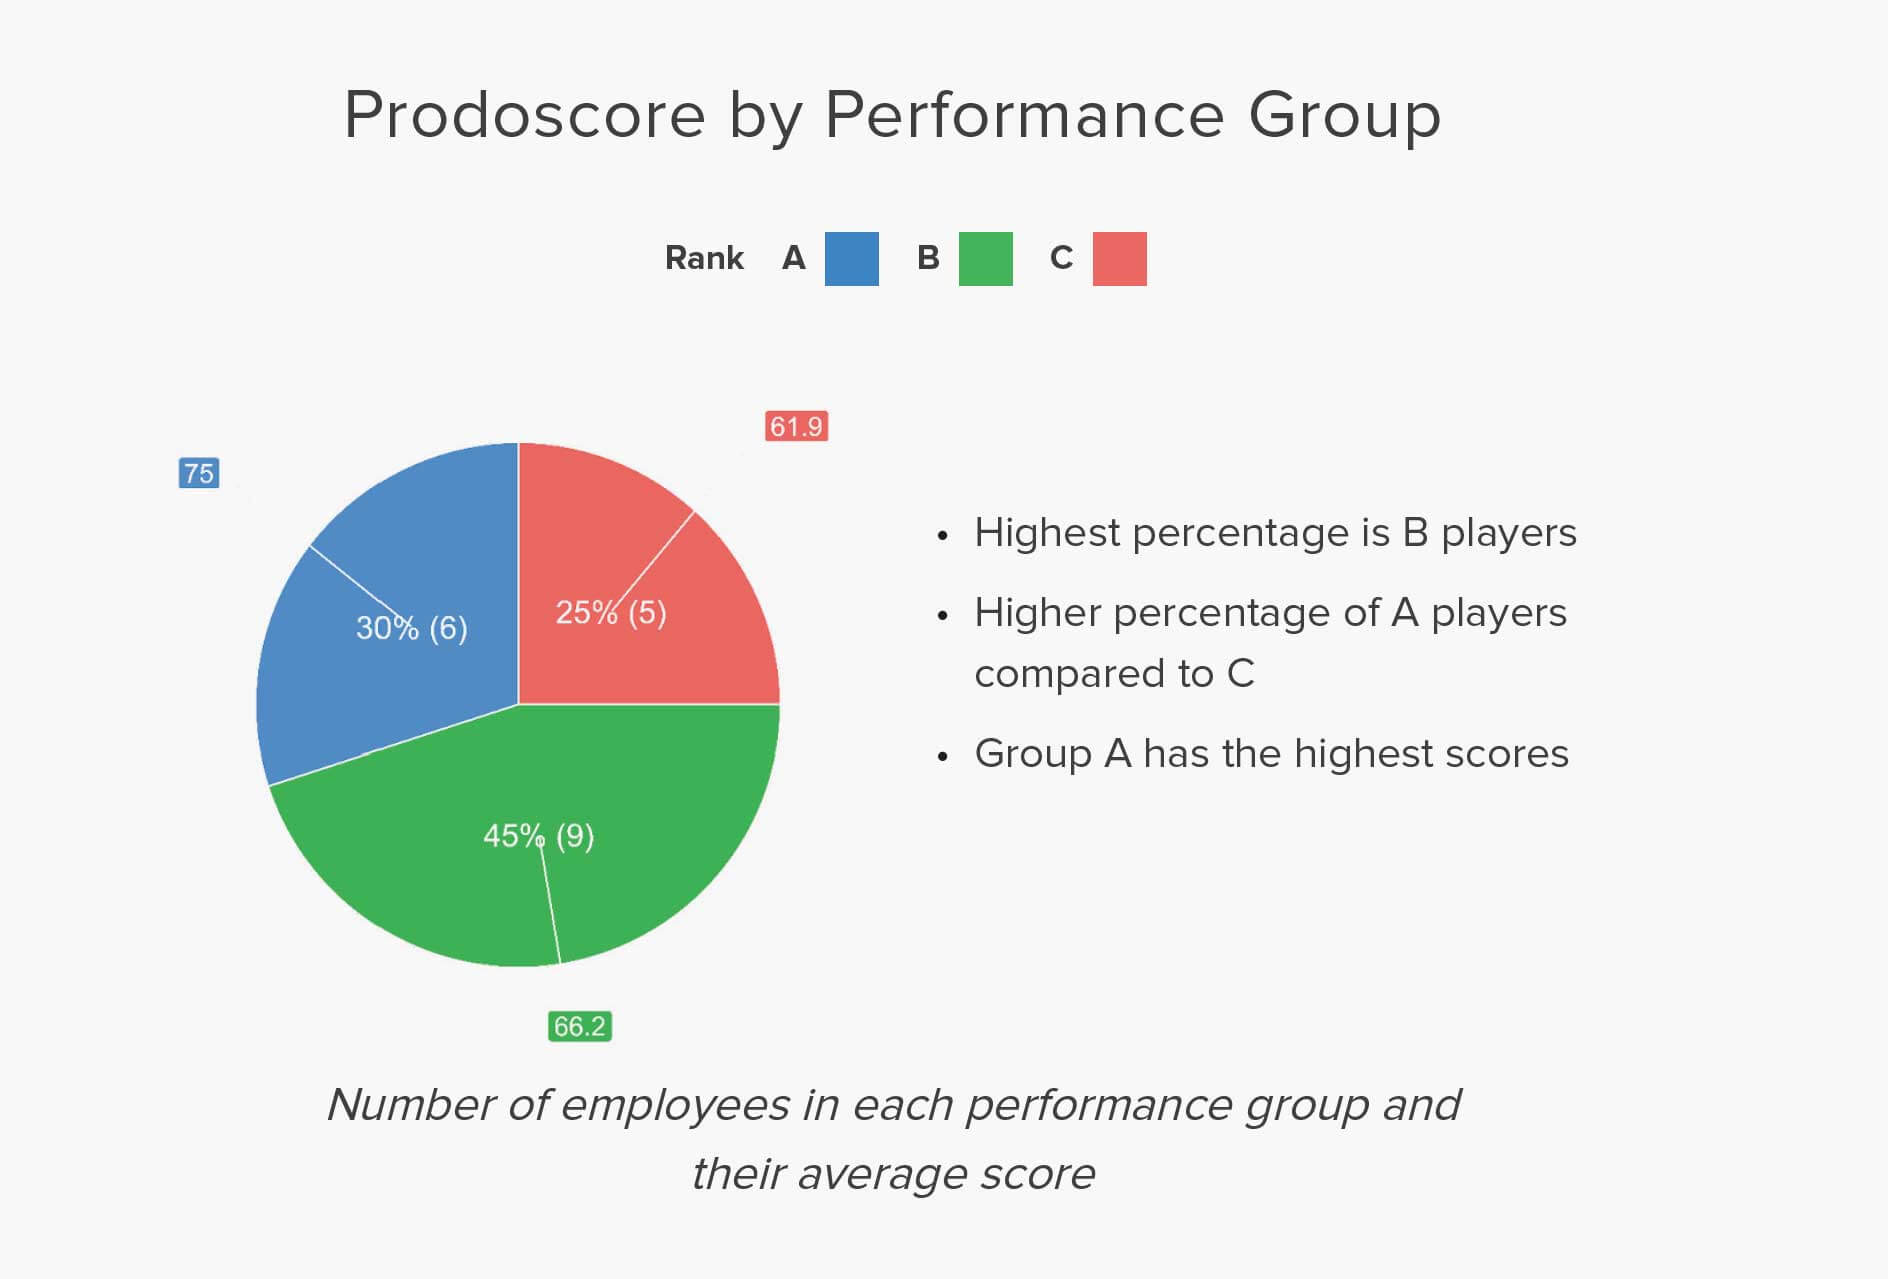
Employees were placed into 3 groups based on performance with A being the top performers and C being the low performers (A, B and C players)