Visualize Employee Contributions with Productivity Metrics
Break Down Data Silos, Boost Efficiency
Tech stacks have become cumbersome and unwieldy. The platforms you think are increasing efficiency might be overburdening your team and decreasing their engagement. And, disparate data sources create siloes that hinder cross-departmental collaboration and communication, which can stunt company growth.
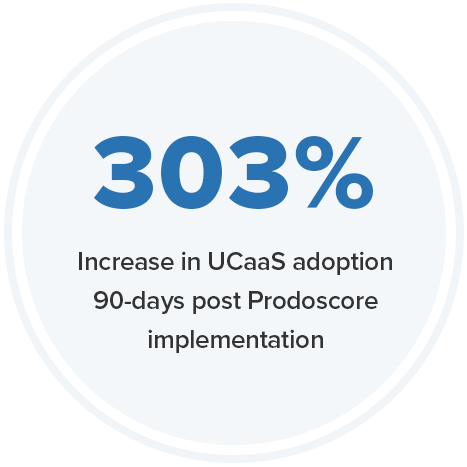
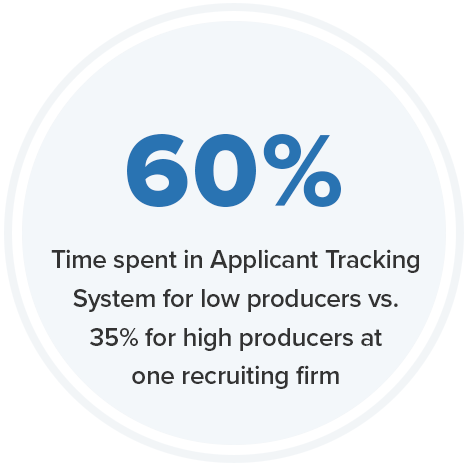
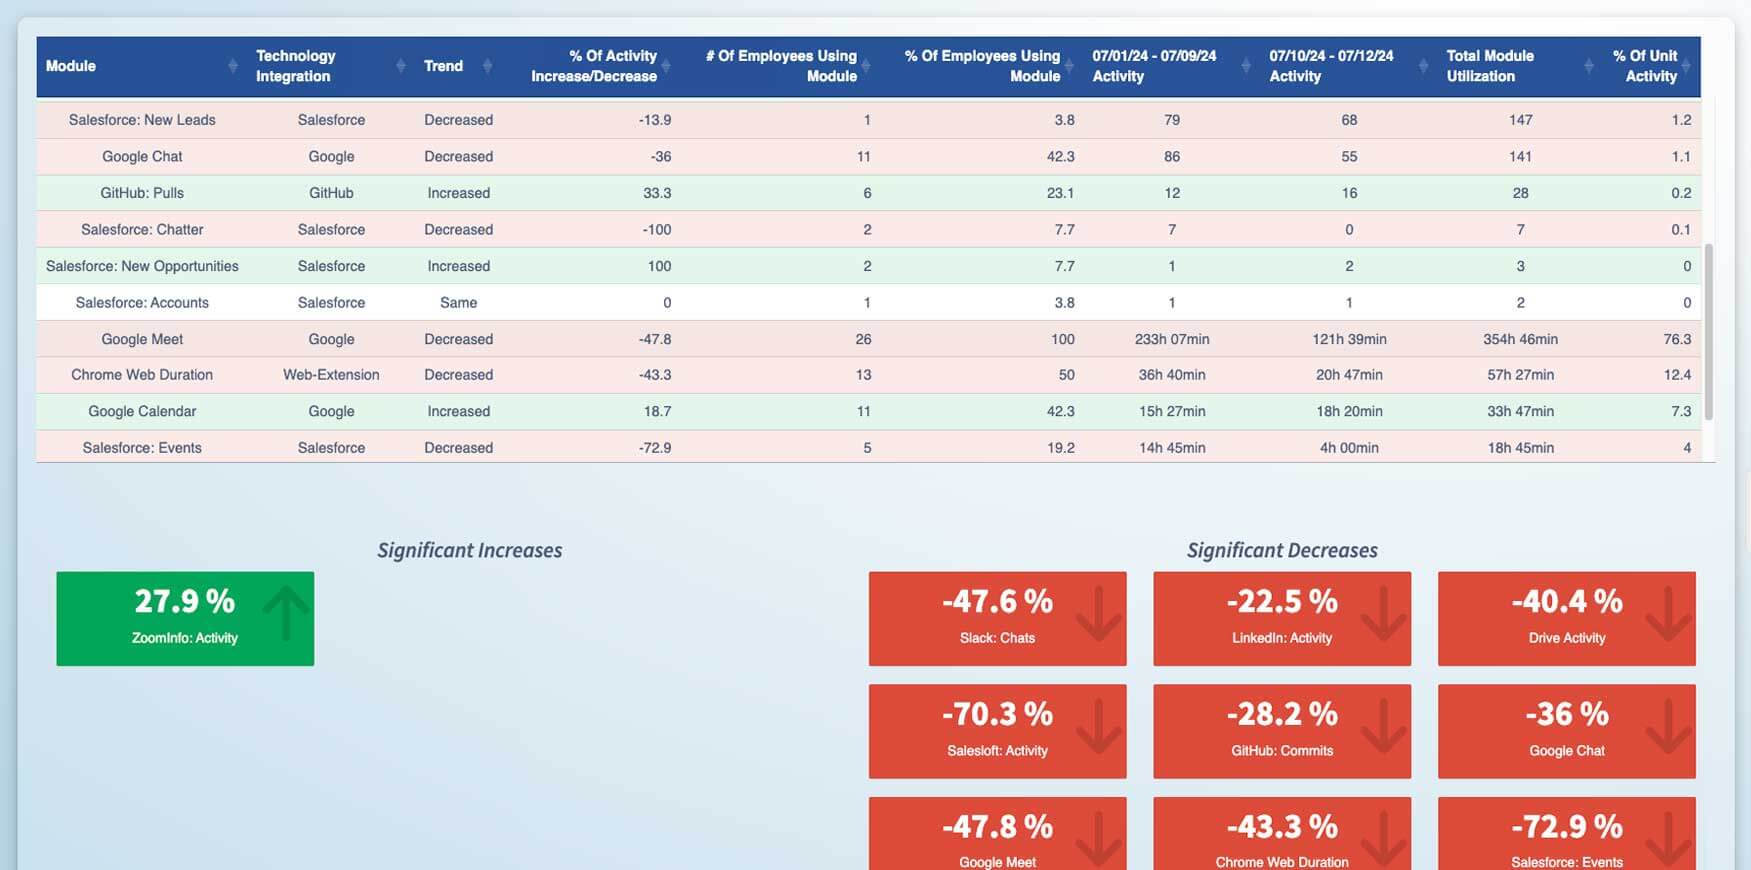
Prodoscore addresses these issues by aggregating data from various tools to provide a comprehensive view of the tech stack and highlight potential cost-saving opportunities. The data also helps identify underutilized tools and training gaps, ensuring that businesses are getting the most out of their technology investments.
Visualize Organizational Data Trends
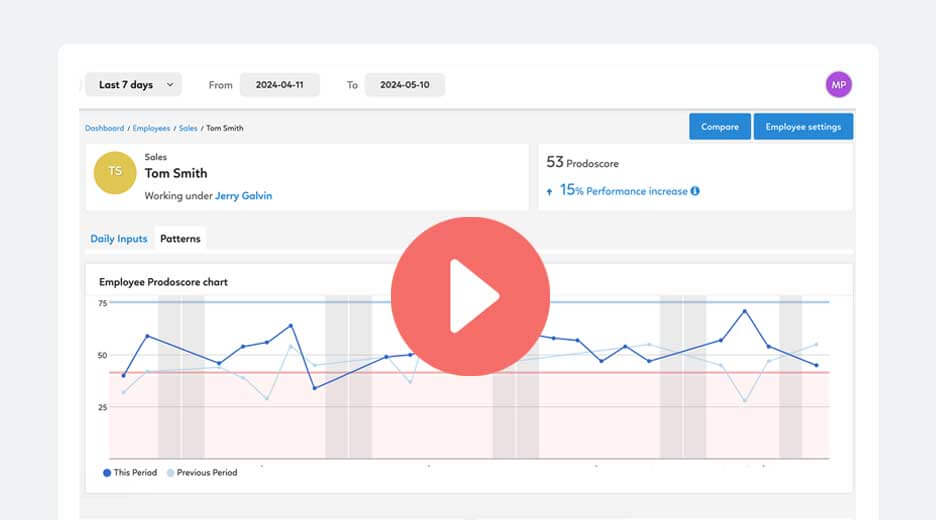
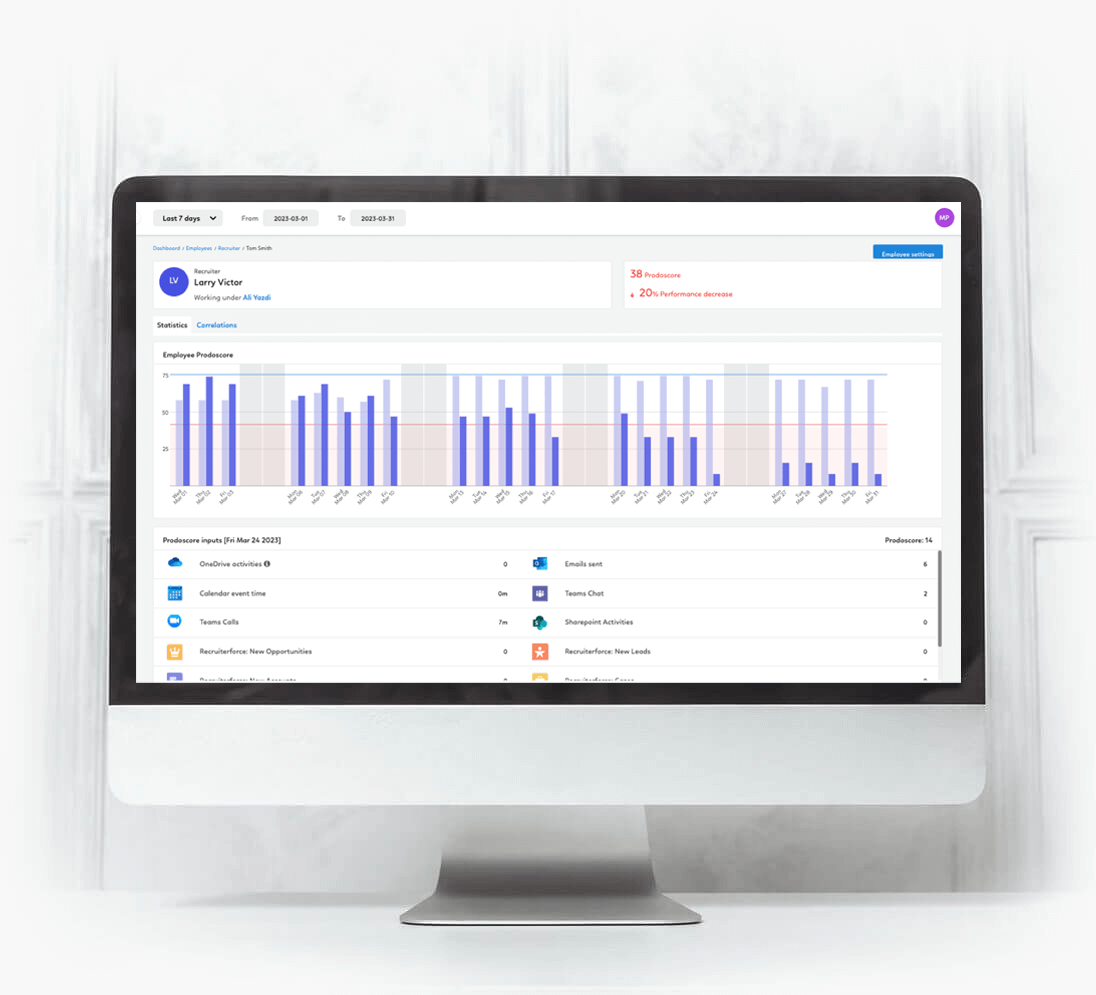
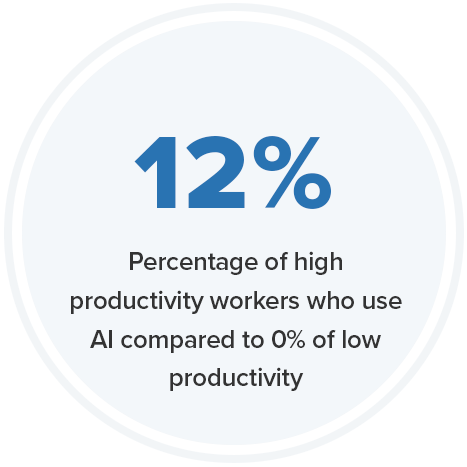
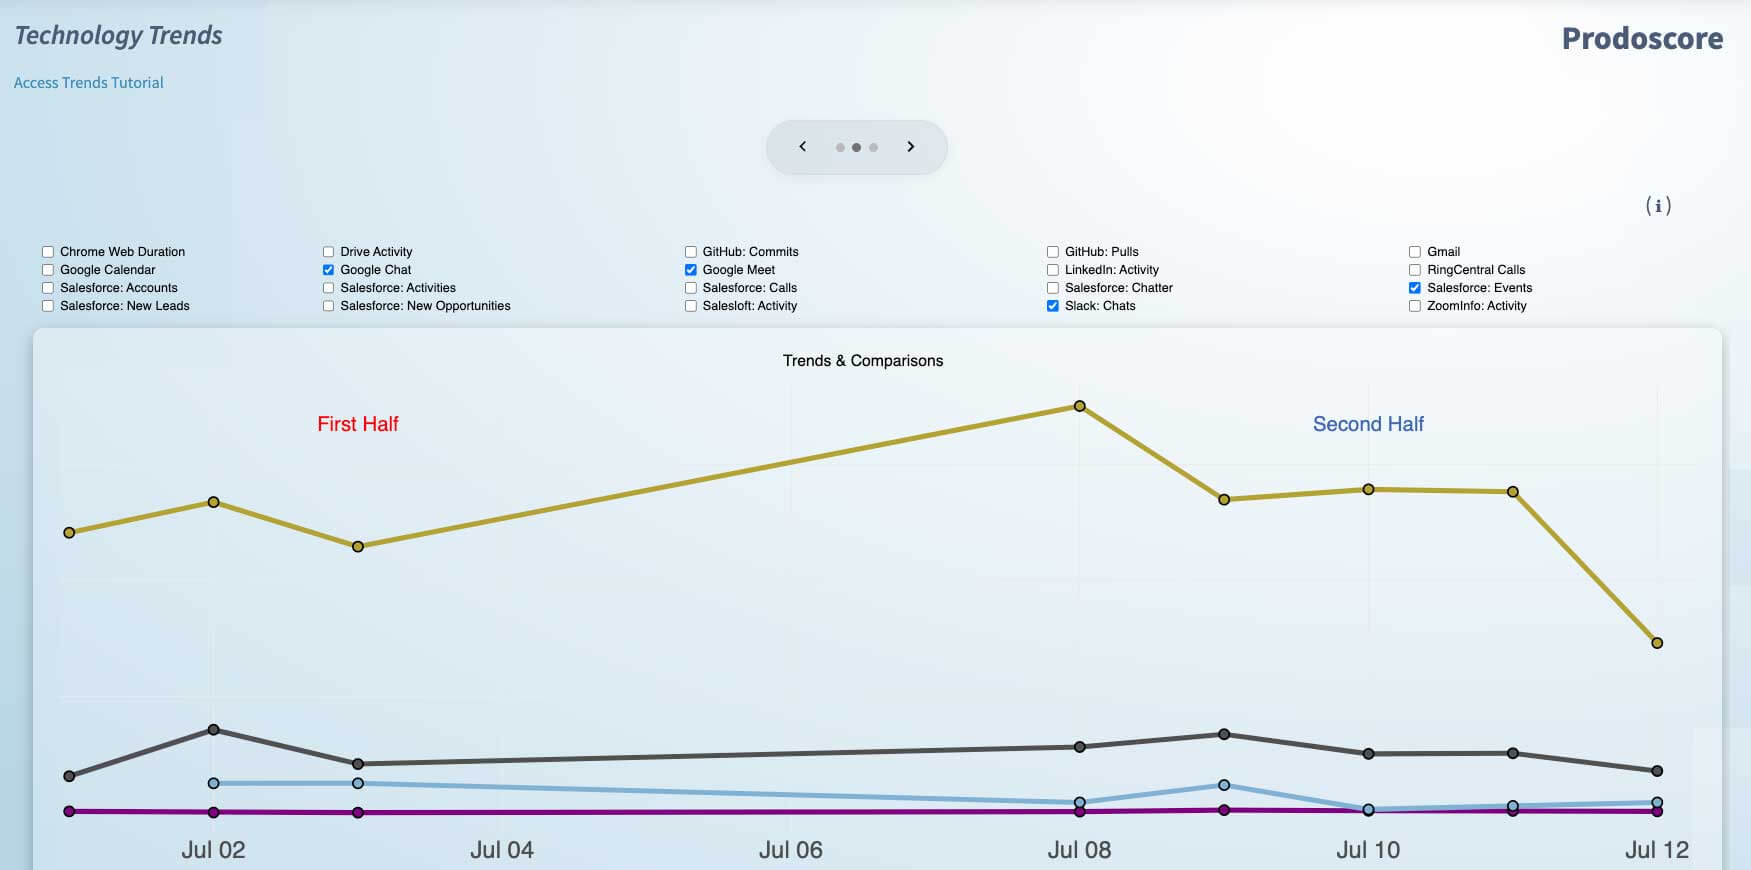
Prodoscore’s data intelligence platform provides the tools needed to visualize employee trends across time so you can make informed business decisions. Using Machine Learning, AI, & Natural Language Processing, Prodoscore measures thousands of daily activity points across core business applications like your office suite, CRM, phone system, and others to visualize employee engagement. Our proprietary scoring system produces key indicators, digestible in seconds, so leaders can make well-informed decisions rooted in data. With visibility and a clearer understanding of critical metrics, Prodoscore enables organizations to realize sizable cost savings by simply understanding what tools are being used and how.
Find out what our customers love about Prodoscore
Location-Based Workplace Productivity
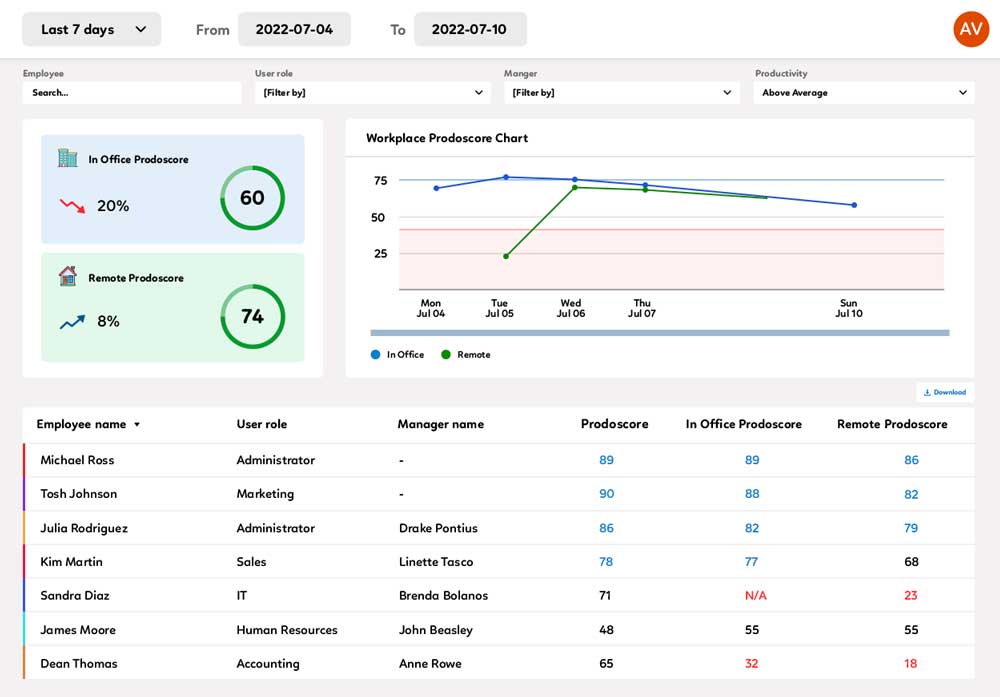
Productivity monitoring tools to gain insight into how employees are engaged remotely vs. in-office.
Endless Integrations
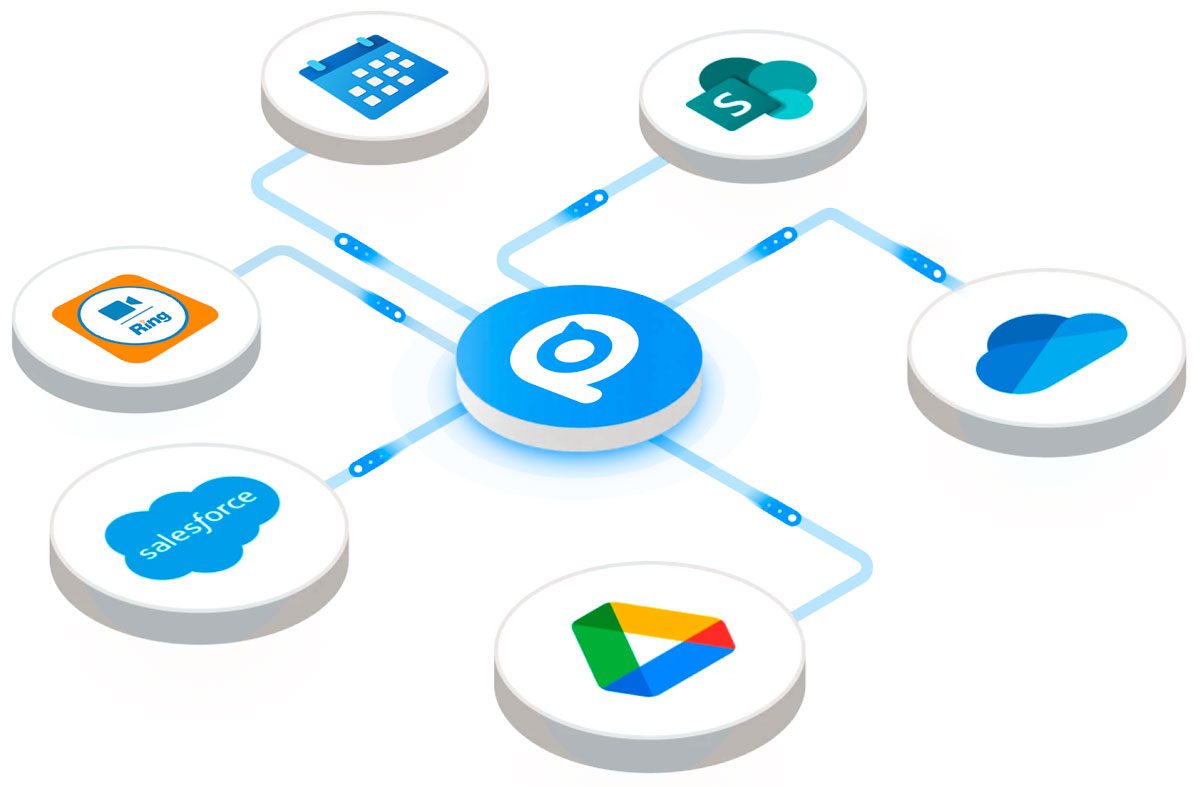
Cloud-based API integration means that employee activity data can be captured from multiple devices vs. just a laptop, enabling more flexibility for employees.
More integrations
Enterprise-Level Employee Data Solutions
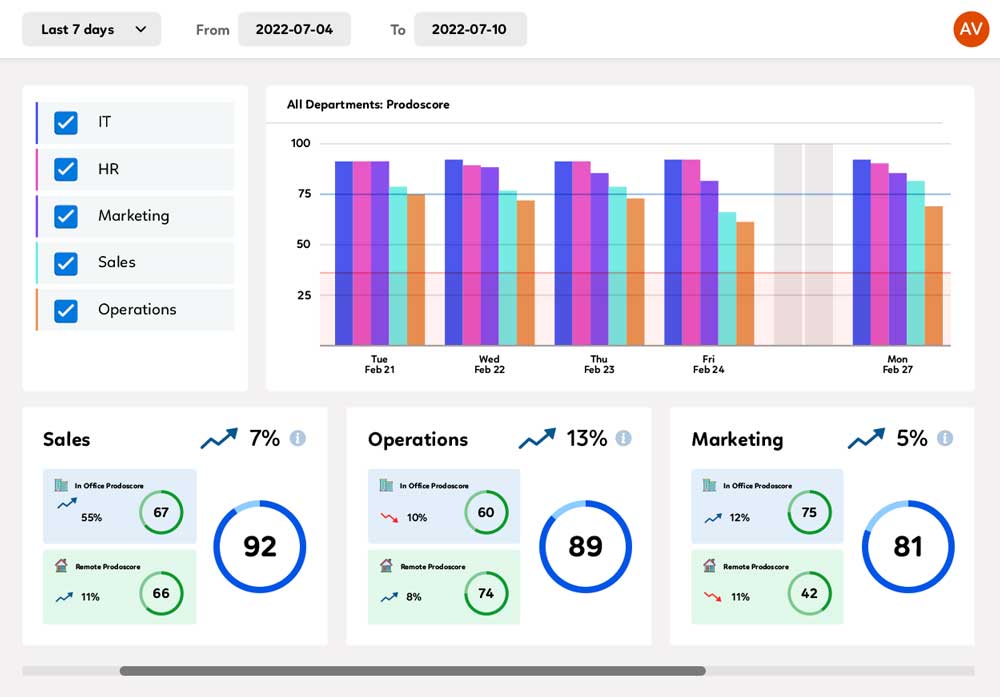
Access engagement and productivity data by department, day and location to understand daily/weekly/monthly data trends, workloads, and more.

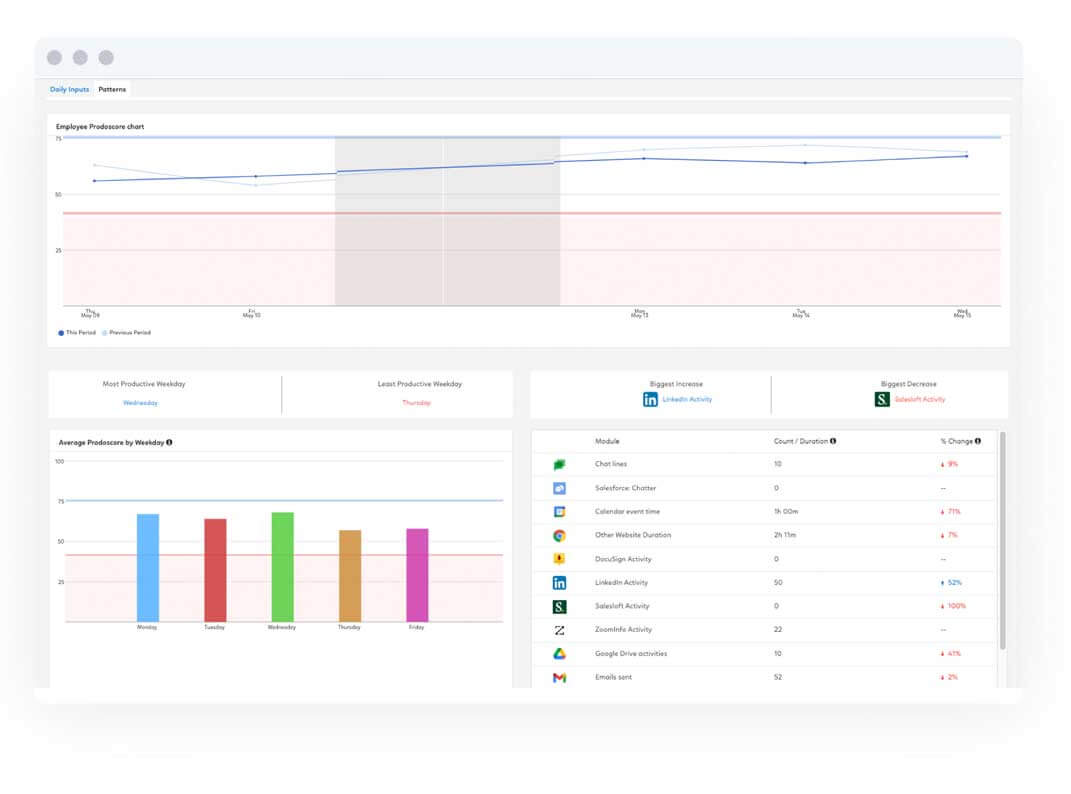
Visualize Employee Patterns
Gauge productivity patterns over a specific period of time to identify busy and slow days, tool usage and productivity by weekday.
Replicate Optimal Productivity
Identify behaviors and trends to replicate success and visualize how top performers spend their days.
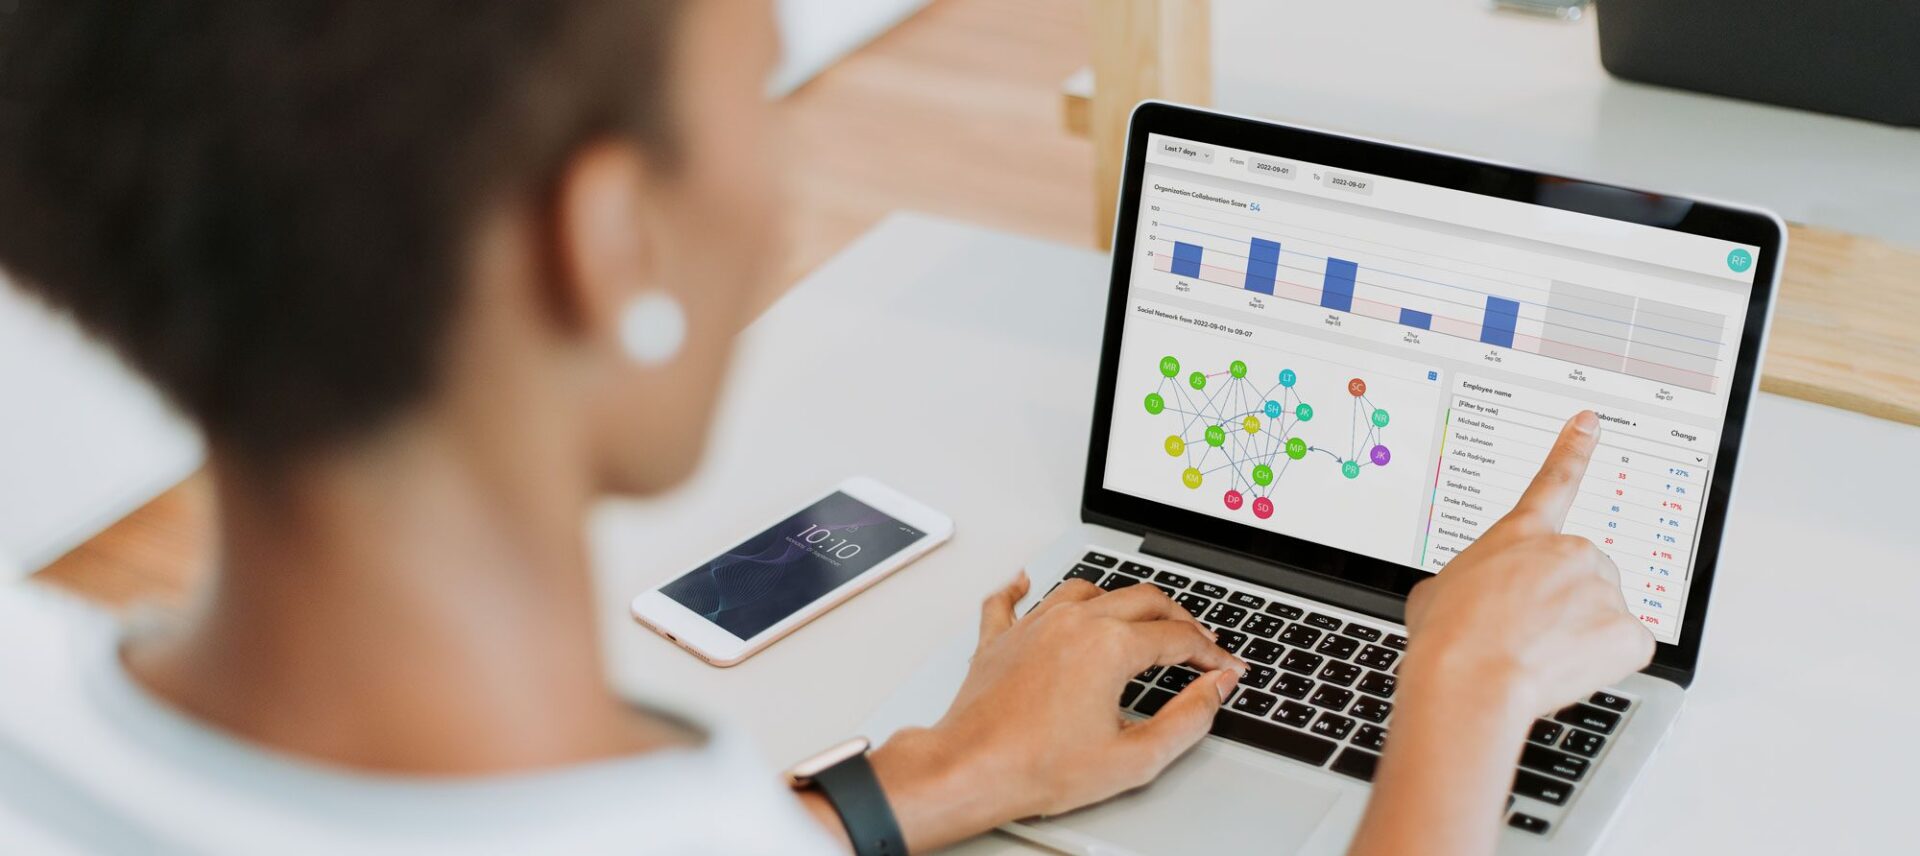
Social Network
Visualize how employees are connected, how they communicate, and what influence they have on each other.
More on Social Network
Are you ready to unlock employee success?
Because great employees need insight, not oversight
