
How AtWork Group Uses Prodoscore to Optimize its Workforce
The Important Role Of Contextualized Data In Business
TL;DR: Raw data without context doesn’t help anyone make a better decision. This guide explains why context is what turns productivity metrics into something useful, and how organizations that connect the dots are seeing real results in employee retention, software adoption rates, and the quality of coaching conversations between managers and their teams.
Table of Contents
- The Role and Benefits of Data
- Data Contextualization
- Introducing Productivity Data in the Workplace
- Uncovering the Value of Contextualized Productivity Data in the Workplace

PART I
The Role and Benefits of Data
Data is such an essential part of how businesses operate today, informing nearly every decision made by organizations of all shapes and sizes, with the potential to significantly impact long-term success. Relying on analytics, businesses can make smarter decisions, realize financial gains, and improve operational efficiencies. Data helps to pinpoint trends and patterns, as well as outliers. It allows for benchmarking and realistic goal setting.
So many business decisions are still made based on intuition. And while we are often encouraged to rely on our “gut” feeling, in business, that can be detrimental. Intuition is certainly valuable in some settings, but critical business decisions cannot be made based solely on intuition. A PWC study suggests that data-driven organizations are 3 times as likely to see improved decision-making. But remember, that doesn’t mean data should always be trusted at face value – it requires interpretation and context. Data helps tell a story with confidence but it’s not the whole story.
Considering the financial implications, companies that embrace data and analytics can experience significant returns, specifically, a 6-9% revenue increase, according to a 2016 McKinsey research report. That number is certainly higher today. Becoming data-driven and reaping the many benefits, however, is not as simple as installing the right software, it’s about creating a data-driven mindset. Factbased decisions need to be made and embraced across all levels of the organization. Data and analytics need to be incorporated into business strategy, information systems and processes.

PART II
Data Contextualization
Gathering and embracing data is the first step. Next is making sense of it.
When properly contextualized, data becomes valuable. Reports and numbers on their own don’t help – the information needs to be presented in a way that benefits the recipient.
By definition, “contextualization” means adding related information to something in order to make it more useful. Data contextualization is common in numerous domains including linguistics, teaching, computer science, and big data, to name a few.
When we consider contextualization of data, we’re referring to data that’s presented, usually in the form of a report, along with trends or patterns that give it meaning. It’s the background information that provides a broader understanding of the topic at hand. Without context, data tends to be of little value. Adding context typically helps unlock key insights and leads to better informed decision making.
Take the thermometer reading of a sick person, for example. Someone has been sick in bed for a week and wants to gauge their progress, so they take their temperature and see a reading of 100 degrees. If they don’t know what their temperature was earlier in the day or week, the reading isn’t all that useful. If they know that on day 1 of their sickness the thermometer read 104 degrees, then things are likely on the right track. If, instead, they started with no fever, it’s possible something is still wrong.
In retail, a reported drop in sales during a given month is not valuable without considering things like traffic patterns, trends at other stores, holidays, month over month trends, etc.
Added context gives data meaning.
Turning to business, when data is properly contextualized, it can be used for things like informing customer relationships, improving sales targeting and forecasting, enhancing marketing campaigns, predicting future economic trends, and better understanding prospect behavior.

PART III
Introducing Productivity Data in the Workplace
If the importance of data in a business setting is obvious, and the value of contextualization equally evident, it seems safe to assume that, armed with data, we can create higher performing teams and more successful businesses overall.
More important during trying times like we’ve experienced over the last year, businesses need strong leaders who have the ability to steer their employees in the right direction, create confidence in the workforce, improve morale, and establish happier and healthier work environments that create a sense of community. Without strong leadership, it’ll be nearly impossible for businesses to flourish in the recovery economy.
Managers can be more effective leaders when they have qualitative, contextualized data that they can use to make good decisions for their team and the company. But, there’s so much data out there, and the volume only seems to be growing. Simply accumulating large amounts of data to be sifted through will not add value to your organization. Instead, value comes from identifying the right data and using it to generate useful insights. The first step is ensuring we’re measuring Introducing Productivity Data in the Workplace PART 3 The Important Role Of Contextualized Data In Business 5 the right things. The second is applying learnings from that information to drive the business forward.
Data provided by productivity intelligence can help managers and supervisors become better at their jobs by offering a simple way to spot trends, identify red flags and opportunities, and know when their workforce is thriving or when it could use a boost. By understanding the outputs (i.e. activities) of employees each day that drive desired results, leaders can provide objective, consistent, and immediate feedback that supports employees and their success. The activities that make up a day, week, or month, and those trends over time, create a view of productivity and engagement that allows managers to make smarter decisions and produce more favorable outcomes.
Productivity intelligence is similar to business intelligence in that it provides “intelligence” about productivity levels in the form of daily engagement. As humans, we are complex beings, so, understanding how we operate and what influences outcomes will only serve to better inform leadership.

PART IV
Uncovering the Value of Contextualized Productivity Data in the Workplace
So, in what areas do organizations typically realize value from productivity intelligence data? Here are a few:
Employee Retention
The ability to better predict when employees are at risk to attrit can have far-reaching implications for an organization. Consider the cost savings alone of knowing 3 weeks in advance that an employee is likely to leave. By removing the element of surprise as it relates to attrition and turnover, productivity intelligence data presents opportunities for immediate process improvement. For example, when there are warning signs, tasks can be reallocated, or teams can invest in crossdepartment training to ensure nothing slips through the cracks.
Red flags become easy to identify in the context of productivity intelligence data. When looking at the average workday, for instance, there is a significant reduction in hours worked for people who intend to leave, versus those who stay. The workday starts later and ends earlier for likely attriters around 5-7 weeks prior to leaving. Focusing on the rate of change across 3 key indicators including an employee’s Prodoscore, calendar time, and email volume, behavioral patterns characteristic of those who attrit can be detected, and addressed quickly. In some cases that may mean finding ways to make the employee happy, in others it could speed up their departure. On its own, any one of these data points may not be meaningful, but when contextualized, they add tremendous value. And over time, trends become clearer. What’s the typical productivity drop off for a tenured employee when they’re no longer engaged? What behaviors suggest that an employee is overworked?
Data provided from research conducted by Adrian Reece, MA, Ph.D Student at Claremont Graduate University, and Principal Statistical Consultant for the Prodoscore Research Council
Employee Experience
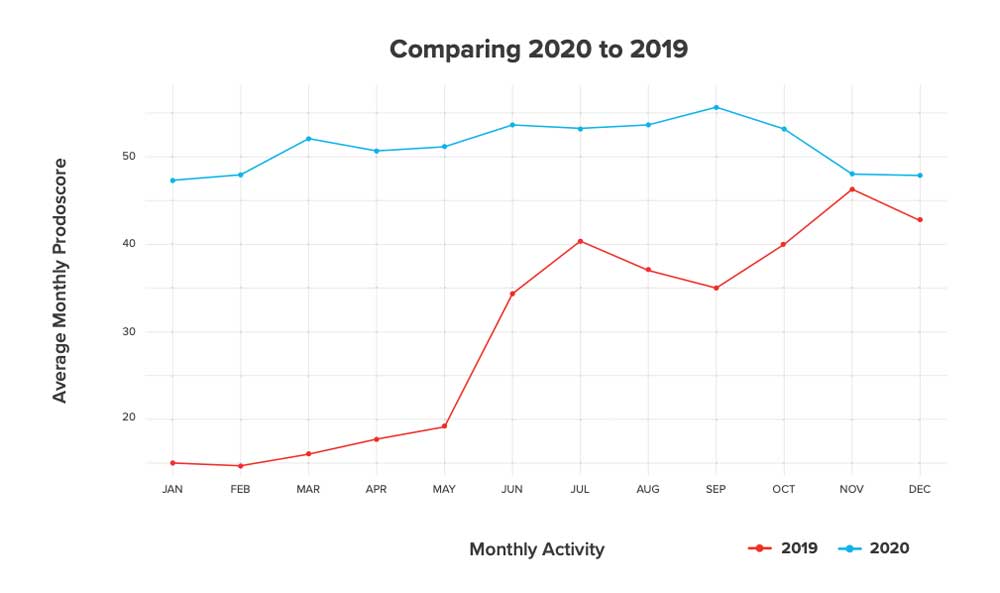
Countless studies have shown that many people enjoy the benefits of working from home; and over the last several months, we’ve learned that productivity is, in fact, just as high, if not higher, in a remote setting. Data from Prodoscore confirms that, while working from home, employees have been engaged. Comparing 2020 to 2019 shows a massive uptick in productivity during a year where the majority of workers were remote. In every month, 2020 was more productive than the year prior. See chart on left.
But it’s really important to examine this data with an understanding of context. The massive shift to a distributed workforce in 2020 has not merely changed where we work, but how we work. Organizations everywhere have (hopefully) realized the importance of embracing flexibility. Encouraging employees to make their own decisions about how they work, and allowing them the freedom to set a pace that makes sense for them, can have a massive impact on mental health as well as the health of the business. The risks of burnout and increased stress are incredibly high and organizations need to create an environment that keeps those risks to a minimum. Whether that means being more flexible about work hours, allowing pets or children to make cameos during video calls, or supporting a “work from the beach day,” flexibility has contributed to the success of the WFH experiment.
Ultimately, it’s not about a destination. Whether a “hybrid” workplace is the way of the future, or we will return to work 100% in-office, it’s critical that we set employees up for success. Streamlining the experience so that employees have the right tools in place, well-defined processes, and an easy way to communicate in a digital-first world, is table stakes today. Using contextualized data to create those opportunities for organizational improvement so leaders better understand how people actually work offers a unique perspective on what patterns and performance fluctuations are normal behavior and when an intervention is necessary.
Cloud-Based Business Applications
Businesses today typically offer a wide range of software applications to enable communication and collaboration, automate processes, and support productivity from anywhere on any device. Ensuring that staff use the apps provided and maintaining consistency in utilization can create efficiencies in process, reporting, and performance. In addition to insightful contextual data that presents a broader understanding of employee engagement in general, you can start to visualize trends. Answers to questions like, “On what days and weeks are employees working in certain tools? How frequently are they collaborating throughout a week or month? Which tools make up the largest part of employees’ workday” can be quickly answered, and help to build that context we keep talking about.
Visibility into software usage also creates accountability. For managers to understand if employees are simply ignoring the solutions you’ve put in place, or struggling with them, creates room for improvement. Should I step in to help or is this person just not interested in participating?
Employee Coaching
Data empowers both managers and employees. In the case of productivity intelligence data, it creates transparency between employees and managers and presents visibility for both. Every manager wants to build and maintain a successful team, right? With the right resources, it’s possible.
However, it’s not enough to simply have data about how much time John from accounting spent in Google Sheets or Cathy from sales spent in Salesforce CRM. To become a better leader, you need to be able to understand what those metrics mean – the context. High or low levels of activity alone, for example, aren’t enough to go on. In order to truly understand and appreciate how people are working, you need to know what’s influencing them, when they’re most (or least) productive, how their recent performance compares to historical trends, how their managers are faring, and how they stack up to the rest of the team.
With the power of contextualized productivity intelligence data at your fingertips, you can become a stronger leader with the ability to make decisions more confidently, better understand how your employees operate on a day-to-day basis, and be ready for open and transparent conversation with your workforce.
Productivity and Performance
Using data to drive decisions around workforce planning, training, coaching, and employee growth presents managers with unbiased insights. When presented in a holistic view and rooted in context, qualified data offers an objective measurement and true viewpoint of employee contributions.
With a data-centric approach to organizational success, businesses can thrive.
How can your organization’s productivity trends impact success?