Q3 2025 Recruiter Benchmark Report
This report provides a benchmark for recruiter activity and work habits, offering staffing firms a comparative standard to evaluate their teams.
By analyzing these key metrics, firms can identify areas of strength and opportunity, optimize their processes, and ultimately improve placement rates and revenue.
About the Report
Activities tracked from 740+ recruiters across core business applications including ATS, calendar, email, phone and virtual meeting systems, and job boards. Total of 3.3M activities were tracked in Q3 2025.
- Productivity | The Foundation of Success
- Work Habits | “First we make our habits, then our habits make us”
- Engagement | The Pulse of Human Connection and Healthy Candidate Pipeline
Productivity
The Foundation of Success
Daily Active Time
5hr 4min
This metric represents the actual time spent on core work applications and tasks, distinguishing it from time logged on a computer.
This is a more accurate measure of engagement than a traditional expectation of an 8-hour workday.
Comparing your team’s active time to the benchmark helps you understand if they are dedicating enough time to revenue-generating activities.
It can also help identify potential burnout if active time is too high or a lack of engagement if it is too low.
Compared to Q2, active time has decreased by approximately 4%.
Average Prodoscore
62
The average Prodoscore is a composite metric that quantifies overall activity across all work applications. It ranges from 0-100.
A higher score generally indicates a higher level of productivity; however, the ideal range is between 40 and 75. If recruiters consistently exceed 75, there is a risk of burnout, and/or additional capacity might be needed to optimize opportunities.
By comparing your team’s average score to the benchmark, you can quickly assess whether they meet or exceed the industry standard for high-value activity.
A lower score might signal a need for process improvements or a different allocation of tasks.
The average score did not change quarter over quarter.
Work Habits
“First we make our habits, then our habits make us”
Start Time
8:01 AM
The average start time indicates a benchmark for when recruiters begin their day (not when they come to the office).
This is a critical metric for a competitive industry like staffing, where early engagement with candidates and clients can be a significant advantage.
Measuring your team’s start time against this benchmark can highlight opportunities to improve morning efficiency.
End Time
6:00 PM
This metric provides insight into the typical duration of a productive workday.
While not a measure of productivity, understanding the average end time helps set realistic expectations and assess work-life balance.
In Q3, daily active time decreased by 16 minutes with a slightly later start time and slightly earlier end time. This is expected because people finish work earlier during the summer months.
Work Location Breakdown
Distribution of Days In-Office vs Remote
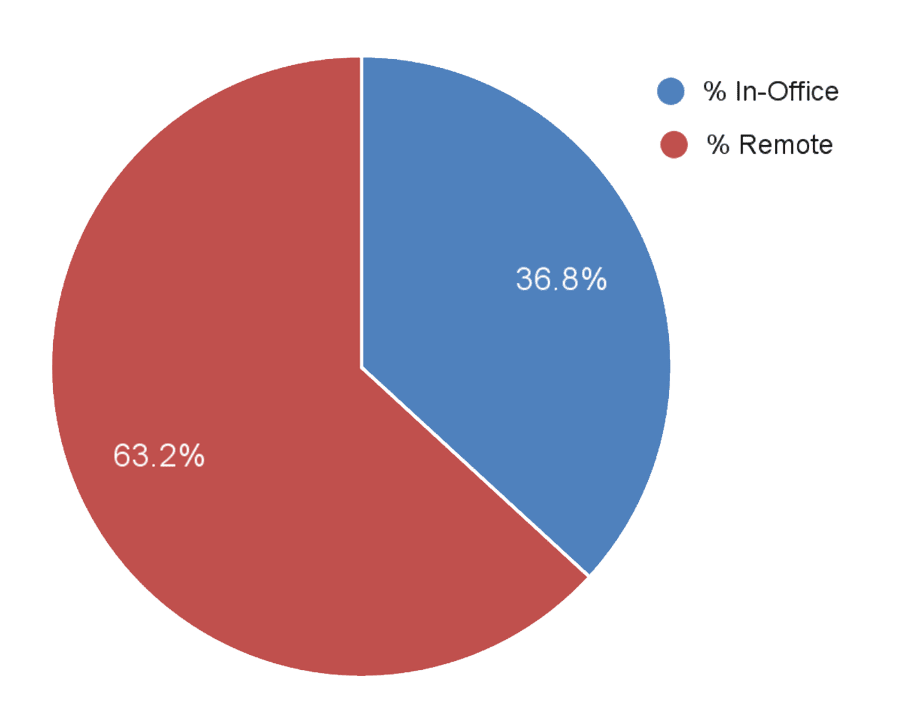
These percentages show the prevailing work model within the industry.
The benchmark highlights a clear trend toward remote work. However, there was a significant change from the first half of 2025, showing a trend toward a return to the office, as the percentage of in-office days increased from 25% to 36.8%.
Firms can use this data to evaluate their own hybrid or remote policies and ensure they are competitive in attracting top talent who may prefer flexible work arrangements.
Work Location Productivity
Prodoscore by Workplace
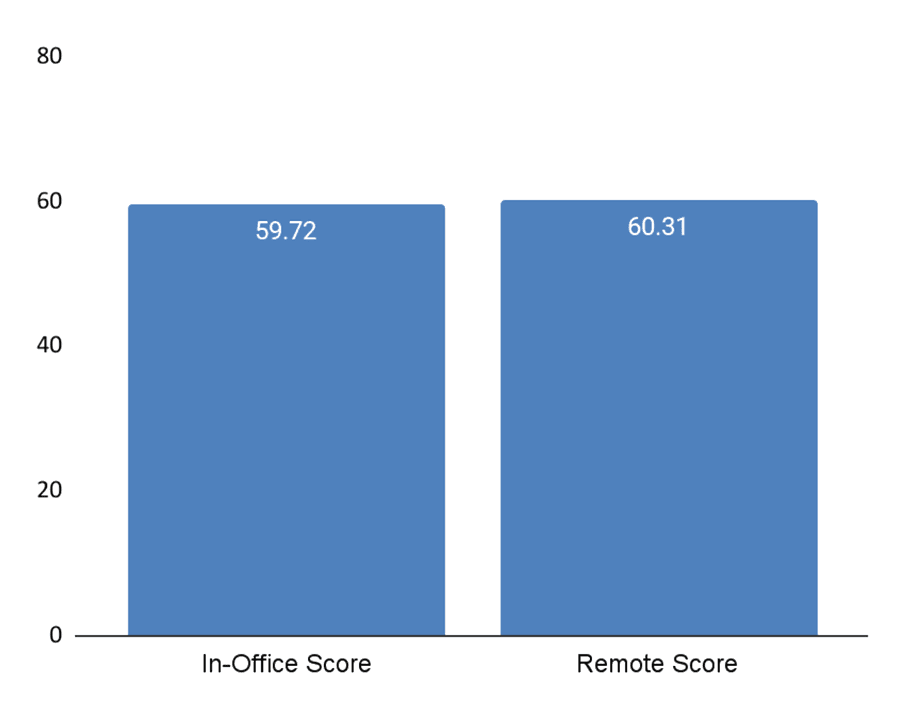
Comparing productivity scores for in-office and remote work models allows firms to understand if a specific work environment is more conducive to productivity.
Even with a shift toward in-office work, the Q3 2025 benchmark data still shows no difference in Recruiter productivity between the two environments.
Staffing firms can use this to make informed decisions about their hybrid work policies without sacrificing performance.
Top vs. Bottom Performing Day
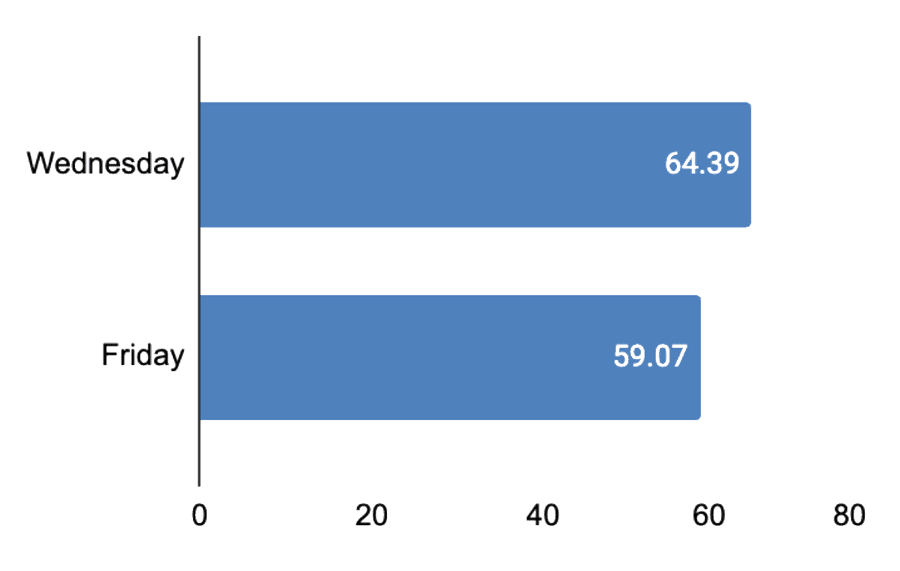
This is a key insight for strategic planning.
Knowing which day is typically the most productive (and least productive) can help firms schedule critical tasks, such as client calls or candidate outreach, when recruiters are most engaged.
It can also inform training and team-building activities on less productive days.
There was no change in the top and bottom-performing weekdays compared to Q2 2025; however, productivity on Wednesday increased from 62 to 64, suggesting that recruiters continue to improve their Wednesday activity.
Engagement
The Pulse of Human Connection and Healthy Candidate Pipeline
Call Activity
Average Calls per Week
95
Average Call Duration
6 min
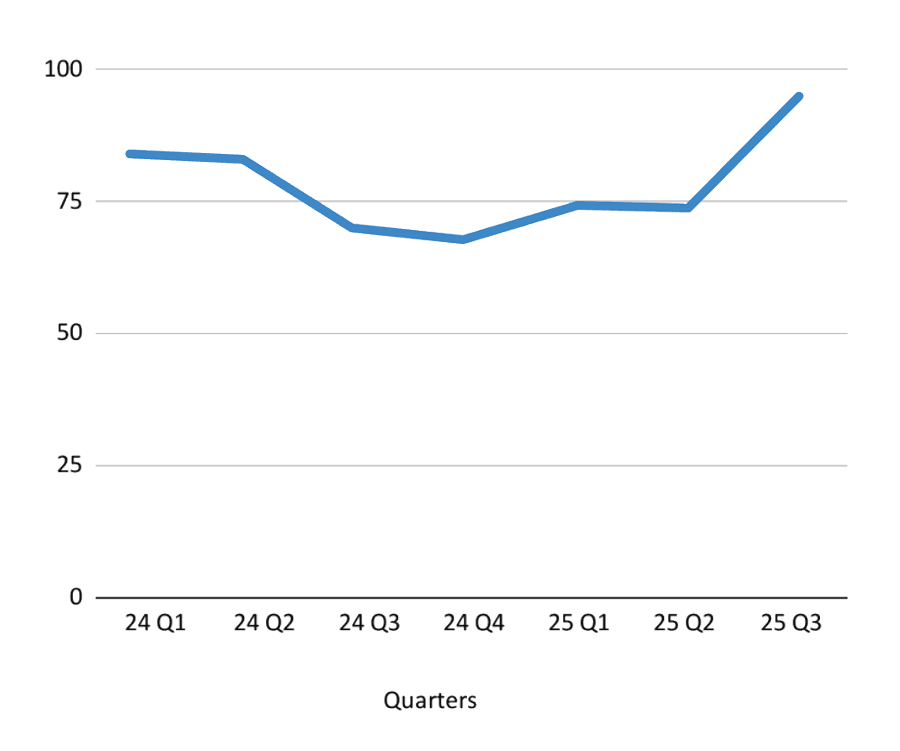
The volume of calls directly indicates a recruiter’s effort in sourcing candidates and connecting with clients.
High call volume demonstrates a strong work ethic, while a healthy call duration per week shows that recruiters are having meaningful, in-depth conversations—not just making quick, superficial calls.
The QoQ trend shows that call activity is up, suggesting that Recruiters are busy with new job placements. In Q3, call volume increased to levels higher than the first half of 2024, which is probably a combination of an increase in job placement opportunities and the difficulty of finding the right talent in the current market.
Best Time to Connect
Tuesday 12pm – 2pm
This time window is when recruiters have the highest number of actual, meaningful conversations (calls lasting over 1 minute).
Targeting this window for critical candidate or client outreach maximizes the chance of connecting directly, leading to faster progress in the recruitment cycle.
If recruiters have high call volumes but low connect rates, managers should coach recruiters and ensure call blocks are being executed within the correct time window to maximize efforts.
In Q2, Wednesdays during the 12 – 2pm window were the preferred time to connect. Recruiters should target Tuesdays and Wednesdays as ideal windows to connect with candidates.
Meeting Activity (Scheduled Virtual Meetings)
Average Meetings per Week
7
Average Meeting Time per Week
2hr 57min
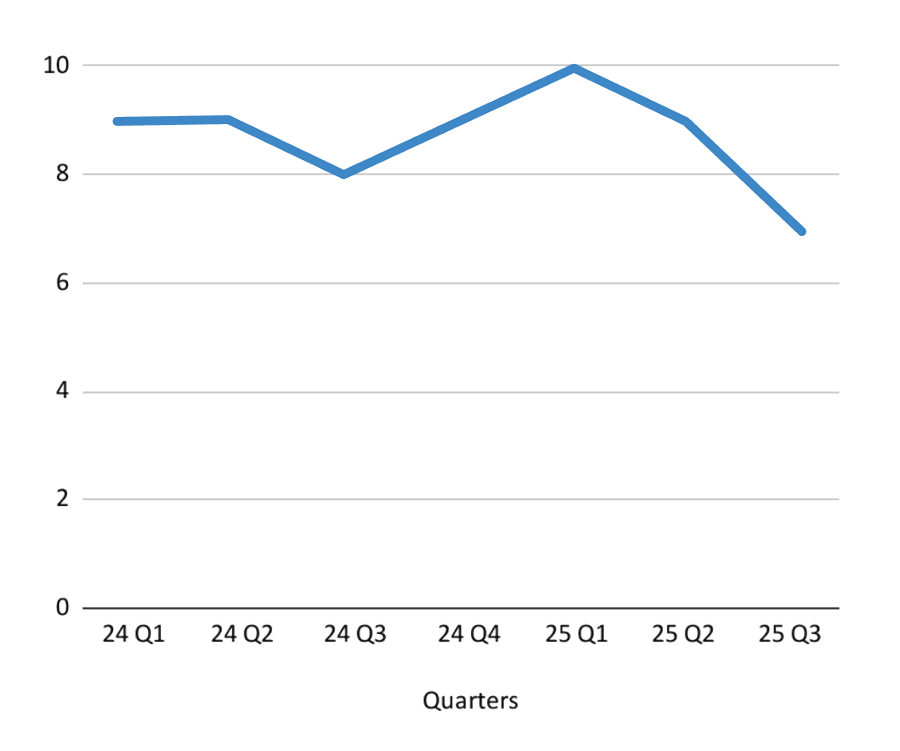
Meetings, from client intake calls to internal strategy sessions, are often critical to the recruitment process.
The number and duration of meetings help determine whether recruiters effectively collaborate and engage with internal and external stakeholders.
The QoQ trend shows that meeting activity decreased over the summer period. As we move into the busier Q4 season, recruiters should aim to increase weekly meetings to 2025 levels of 9-10/week.
Email Activity
Average Emails per Week
55
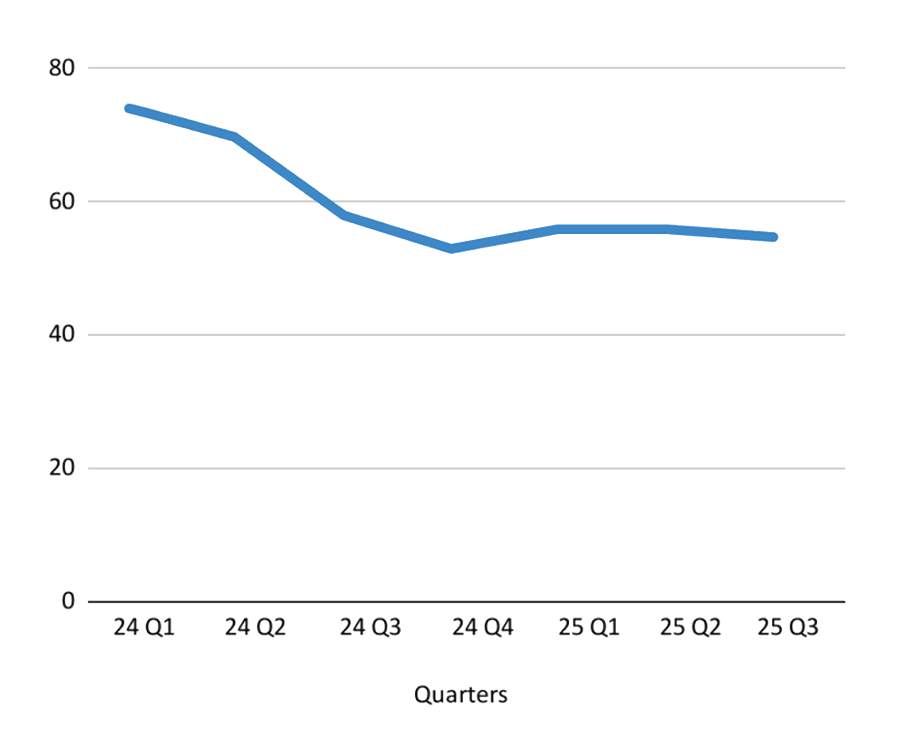
Email volume is a key indicator of communication and outreach. It shows how actively recruiters correspond with candidates, clients, and internal teams.
A lower-than-benchmark email count might signal a missed opportunity to follow up with leads or maintain candidate pipelines.
Unlike the uptrend in call activity, the QoQ trend of email activity shows a downtrend. This shows a potential impact of AI tools taking over email outreach and recruiters refocusing efforts on higher levels of personalization.
Find out how your organization compares