Where Data Science Meets Workforce Strategy
Prodoscore has always been a data company at its core. Behind every productivity score, every trend line, and every insight surfaced in your dashboard is a team of data scientists who have spent years studying how work actually happens, not how org charts suggest it should.
Our Research and Analytics practice takes that expertise further. Through a combination of proprietary workforce data, advanced modeling, and deep collaboration with your leadership team, we translate raw activity signals into findings that change how organizations operate. Whether you need a one-time deep dive or an ongoing analytics partnership, our Data Science team builds the analysis to fit the question you’re actually asking.
Daily activity signals captured per month
Enterprise integrations supported
Custom reports delivered to date
Not Just Dashboards…Answers
Our platform captures thousands of daily activity signals across your core business applications and our Data Science team turns that raw material into structured, interpretable analysis tailored to your industry, your roles, and the specific business questions you’re trying to resolve. This is not off-the-shelf reporting, it is a custom analysis built around what matters most to your organization.
SAMPLE FINDINGS
The #1 predictor of performance isn’t how much someone works, it’s how consistently they show up.
Top performers show up the same way every day.
This pattern held true in 88% of organizations, across staffing, legal, tech, and 3 other industries.
Top performers put in 67 more focused minutes per day. That’s 5.6 extra hours per week.
Top performers use Outlook 1.75x more and Teams 1.60x more than bottom performers.
One staffing firm identified a $740K coachable revenue gap.
Top reps: $924K. Bottom reps: $184K. Same role, same time period, same tools.
Revenue lags behavior by 3 weeks giving managers a window to coach before numbers drop.
The revenue gap between top and bottom is addressable. It’s not talent, it’s behavior.
Time off had zero negative impact on performance. People who take PTO perform just as well.
Four Areas Where Custom Analysis Drives Impact
Our most common report types cover these workforce intelligence themes — each designed around a question leaders are already asking.
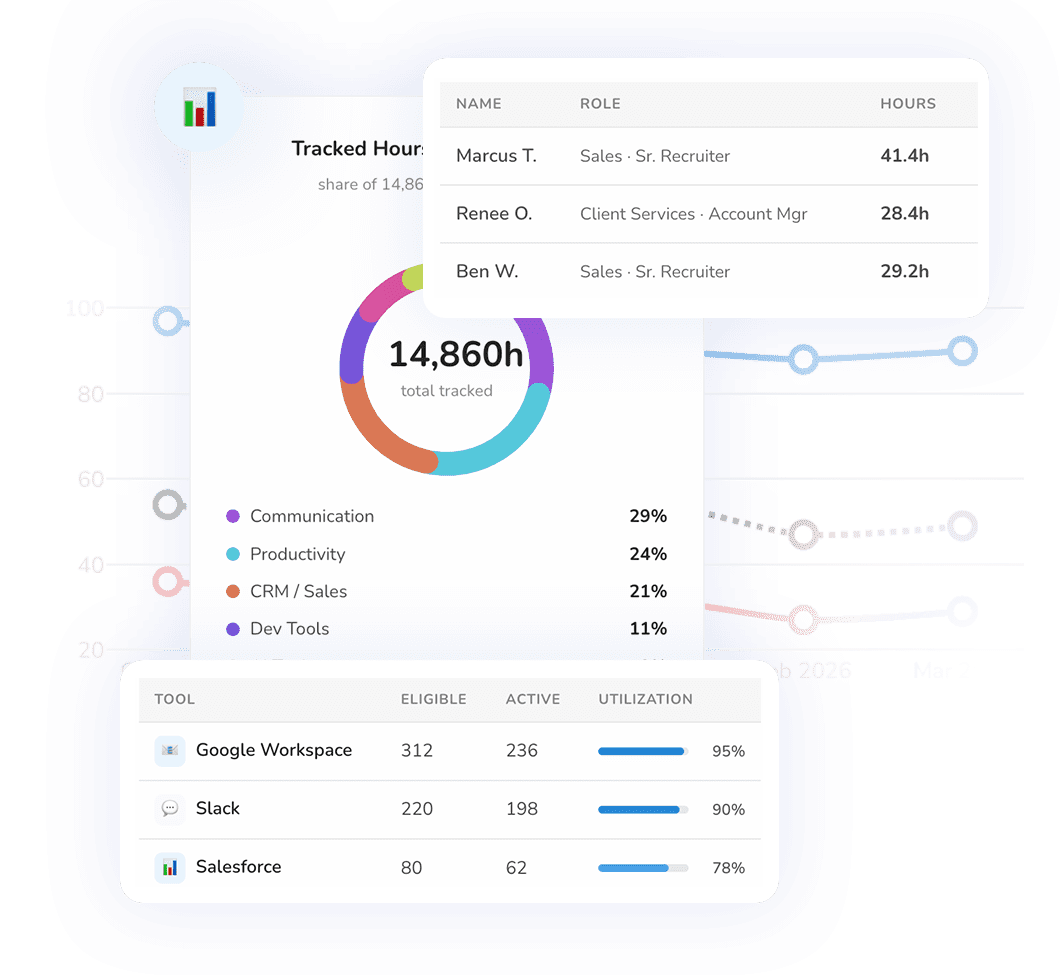
Team-level productivity scores and trends that give managers a clear, objective read on where performance stands and what is driving it.
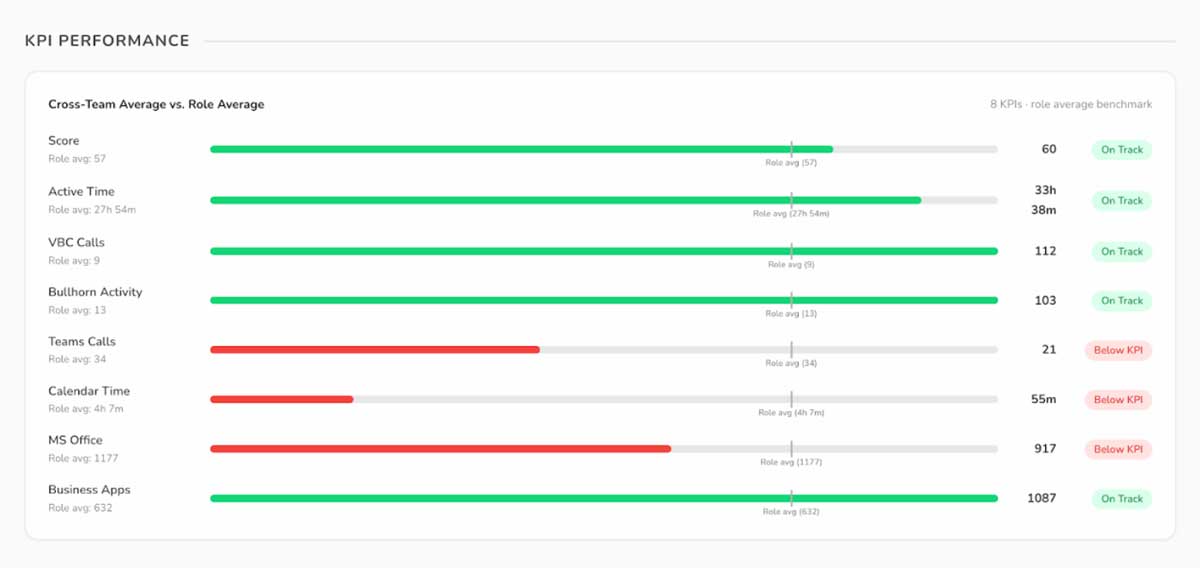
KPI Performance Metrics
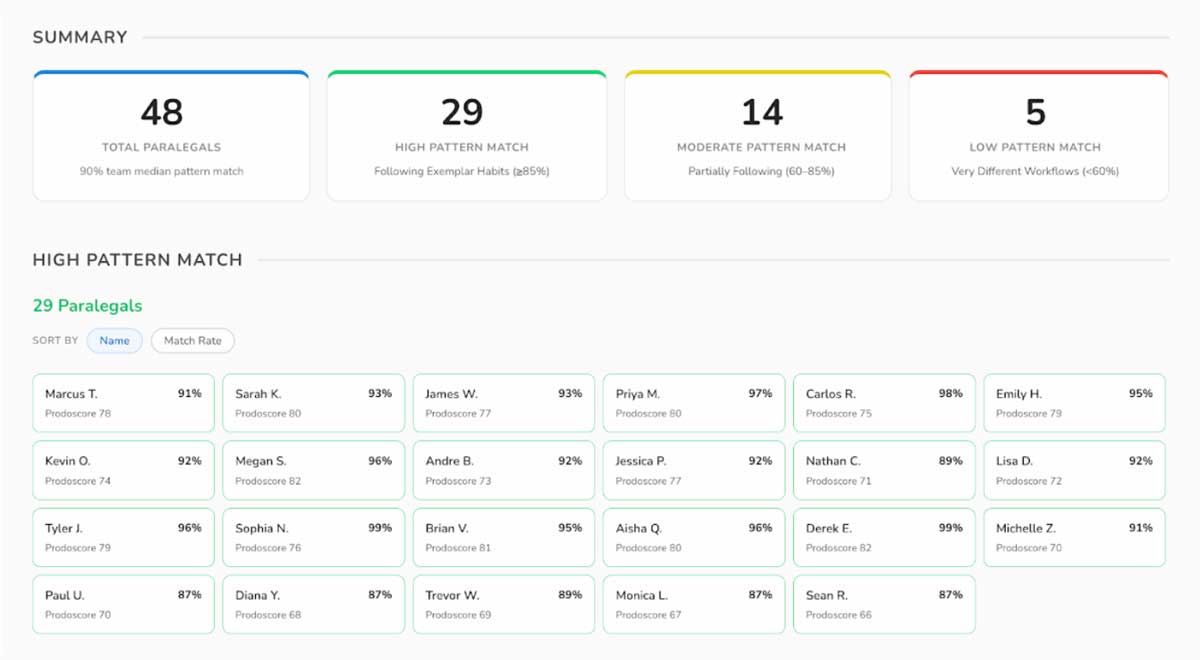
Exemplar playbooks and behavioral breakdowns that turn high-performer patterns into repeatable coaching material.
Exemplar Playbook
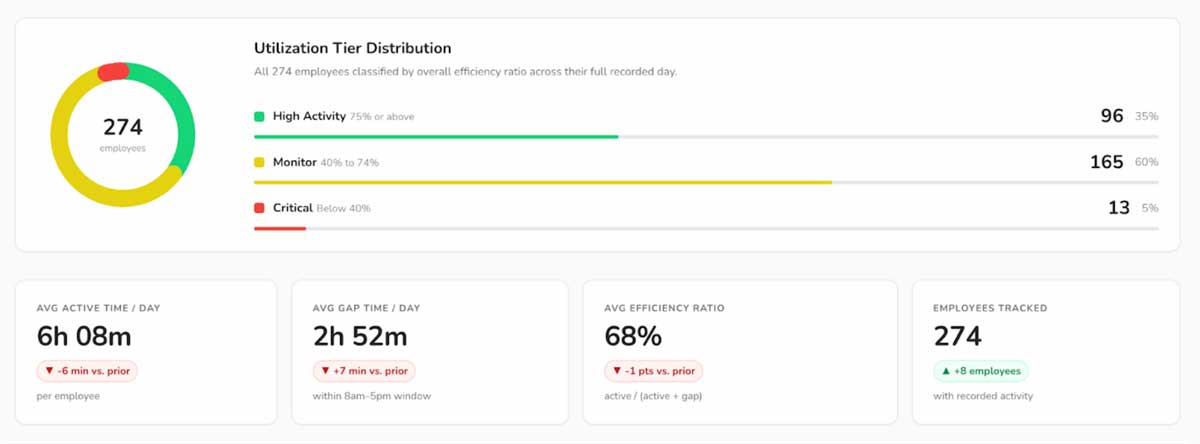
Active time and gap time analysis that shows where productive hours are going and where capacity slack exists across teams.
Active & Gap Time Overview
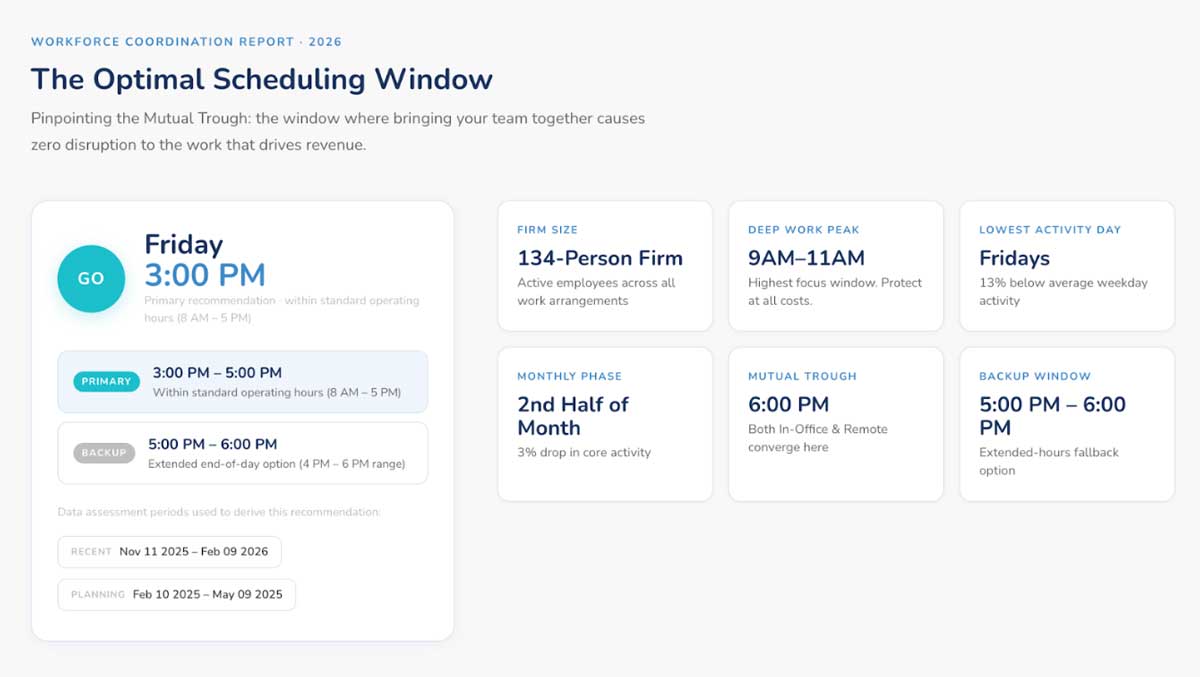
Data on optimal meeting windows so leaders can protect deep-work blocks and build a meeting culture that respects how work actually gets done.
Optimal Scheduling Insights
Discover how your team members interact and share information
Understanding who is doing what is only part of the picture. ONA maps the real communication and collaboration patterns inside your organization, going beyond the formal hierarchy to reveal true influencers, knowledge-sharing hubs, and silos that quietly erode productivity.
Network density has a meaningful and measurable impact on organizational output, and our ONA capabilities help leaders understand that relationship with precision.
of managers have daily contact with all of their team members
time managers spend communicating with their team members
Early detection of flight risk with ONA engagement data
Research You Can Stand Behind
Prodoscore’s Data Science team does not just work inside your data — they contribute to the broader field. Our published research and quarterly workforce reports draw on aggregated, anonymized data from across our customer base to surface trends in AI adoption, productivity patterns, hybrid work outcomes, and more. These findings have been cited by HR leaders, executive teams, and workforce researchers as a reliable, methodology-backed source of insight.
When you partner with our Research and Analytics team, you benefit from that same rigor applied directly to your organization.
FIVE THINGS WE’VE LEARNED
Reports Library
Sales Benchmark Q4 2025 Insights
View report
Recruiter Benchmark Q4 2025 Insights
View report
Productivity Pulse: Q4 2025 Report
View report
Sales Benchmark Q3 2025 Insights
View report
Recruiter Benchmark Q3 2025 Insights
View report
Recruiter Benchmark Q2 2025 Insights
View report
Productivity Pulse: Q3 2025 Report
View report
Productivity Pulse: Q2 2025 Report
View report
Productivity Pulse: Q1 2025 Report
View report
2024 Legal Industry Report
View report
2024 Staffing Industry Report
View reportFrom question to insight
Every engagement starts with a conversation about what you are trying to understand. From there, our Data Science team scopes the analysis, builds the report, and walks you through the findings.
We start with a scoping conversation to understand the business challenge and identify the right data sources.
Our Data Science team runs the analysis, surfaces the patterns, and structures findings into a clear, actionable report.
We walk your team through the results and help translate insights into decisions your leaders can move on.
Have a workforce question you haven’t been able to answer?
If you have a workforce question you have not been able to answer with standard reporting, our Data Science team would like to hear it. We work best when the problem is specific, the stakes are real, and the organization is ready to act on what the data shows.