Q4 2025 Recruiter Benchmark Report
This report provides a benchmark for recruiter activity and work habits, offering staffing firms a comparative standard to evaluate their teams.
By analyzing these key metrics, firms can identify areas of strength and opportunity, optimize their processes, and ultimately improve placement rates and revenue.
About the Report
This report is based on the activities tracked from 800+ recruiters across core business applications including ATS, calendar, email, phone and virtual meeting systems, and job boards. A total of 3.9M activities were tracked in Q4 2025.
The report is organized into three main areas:
- Productivity | The Foundation of Success
- Work Habits | “First we make our habits, then our habits make us”
- Engagement | The Pulse of Human Connection and Healthy Candidate Pipeline
- Tool Adoption | Technology is only impactful when adopted by your team
Productivity
The Foundation of Success
Daily Active Time
4hr 15min
This metric represents the actual time spent on core work applications and tasks, distinguishing it from time logged on a computer.
This is a more accurate measure of engagement than a traditional 8-hour workday.
Comparing your team’s active time to the benchmark helps you understand if they are dedicating enough time to revenue-generating activities.
It can also help identify potential burnout if active time is too high or a lack of engagement if it is too low.
Compared to Q3, we saw a 15% decline in daily active time.
Average Prodoscore
59
The average Prodoscore is a composite metric that quantifies overall activity across all work applications. It ranges from 0-100.
A higher score generally indicates higher productivity; however, the ideal range is 40-75. If recruiters consistently exceed 75, there is a risk of burnout, and/or additional capacity might be needed to optimize market opportunity.
By comparing your team’s average score to the benchmark, you can quickly assess whether your team meets or exceeds the industry standard for high-value activity.
A lower score may indicate the need for process improvements or a different task allocation.
The average Prodoscore declined 5% quarter over quarter.
Work Habits
“First we make our habits, then our habits make us”
Start Time
7:40 AM
The average start time serves as a benchmark for when recruiters begin their day (not when they arrive at the office).
This is a critical metric for a competitive industry like staffing, where early engagement with candidates and clients can be a significant advantage.
Measuring your team’s start time against this benchmark can highlight opportunities to improve morning efficiency.
End Time
5:31 PM
This metric provides insight into the typical duration of a productive workday.
While not a measure of productivity itself, understanding the average end time helps set realistic expectations and assess work-life balance.
Both the average start and end times moved up in Q4.
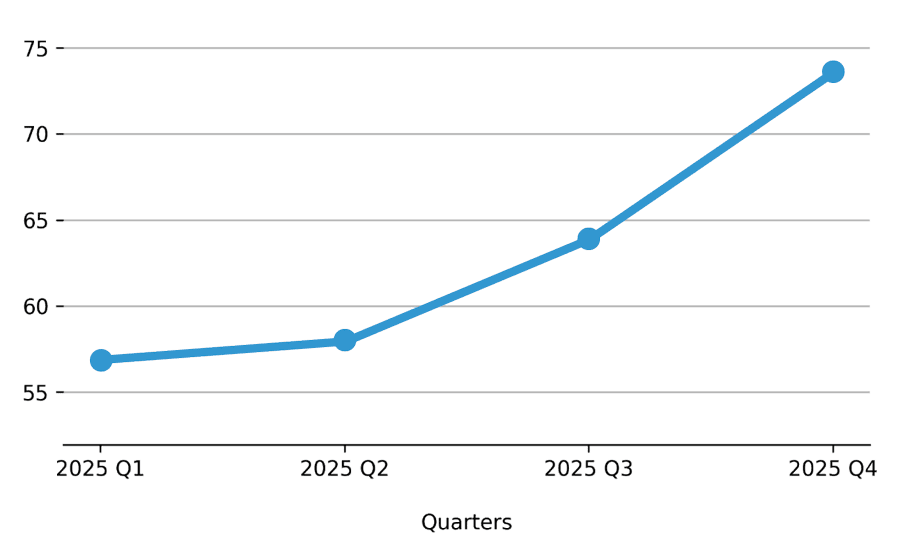
Work Location Breakdown
Distribution of Days In-Office vs Remote
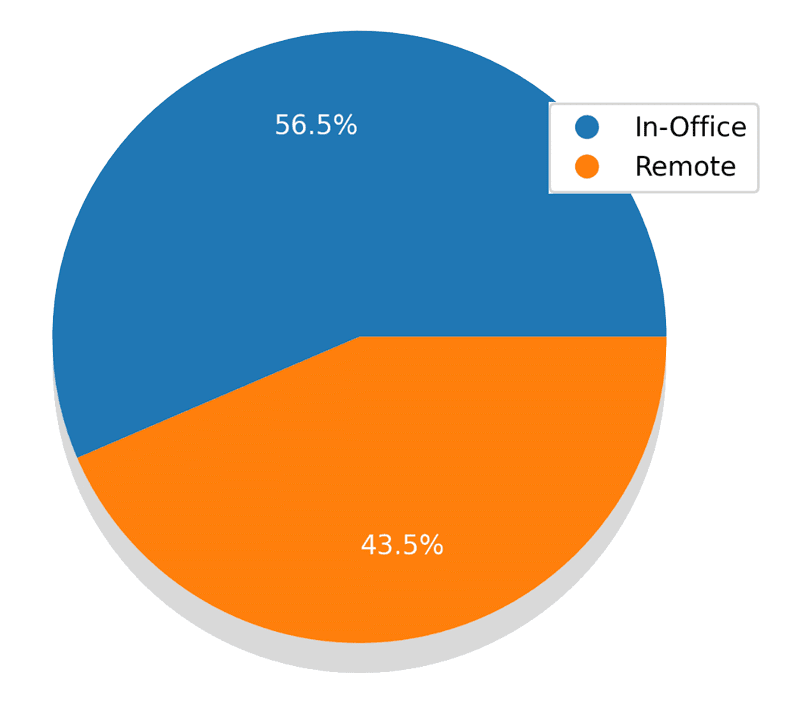
These percentages show the prevailing work model within the industry.
Firms can use this data to evaluate their own hybrid or remote policies and ensure they are competitive in attracting top talent who may prefer flexible work arrangements.
Q4 saw a shift in work location with the percentage of days in the office up from 37% to 56.47%. This shows a continued push toward in-office work locations. However, this also creates an opportunity for smaller firms to attract top talent by offering flexibility. With current productivity monitoring solutions, firms don’t need to force recruiters to commute to an office just to have visibility into their day-to-day.
Work Location Productivity
Prodoscore by Workplace
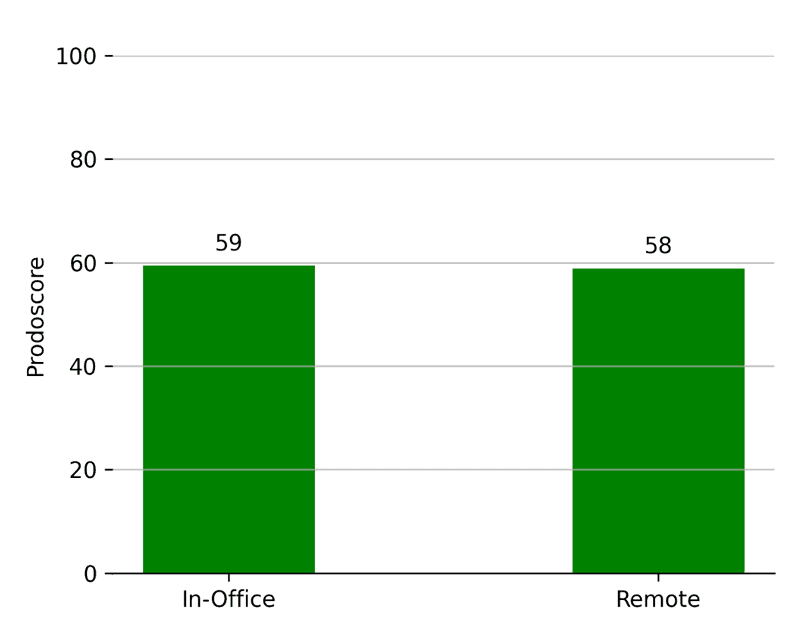
Comparing productivity scores between in-office and remote work models helps firms determine whether one work environment is more productive.
The data suggests that for the Q4 2025 benchmark, there is virtually no difference in productivity between the two environments.
Staffing firms can use this to make informed decisions about their hybrid work policies without sacrificing performance.
Top vs. Bottom Performing Day
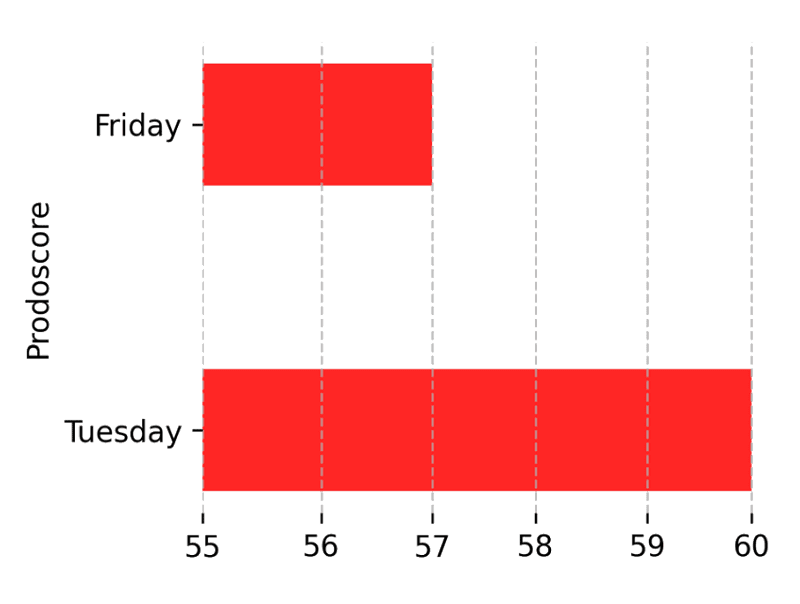
This is a key insight for strategic planning.
Knowing which day is typically the most productive (and least productive) can help firms schedule critical tasks, such as client calls or candidate outreach, when recruiters are most engaged.
It can also inform training and team-building activities on less productive days.
Friday is consistently the lowest-performing weekday. In Q4 Tuesday was the highest performing day compared to Wednesday in Q3.
Engagement
The Pulse of Human Connection and Healthy Candidate Pipeline
Call Activity
Average Calls per Week
78
Average Call Duration
7 min
The volume of calls directly indicates a recruiter’s effort in sourcing candidates and connecting with clients.
High call volume demonstrates a strong work ethic, while a healthy weekly call duration indicates recruiters are having meaningful, in-depth conversations—not just making quick, superficial calls.
The QoQ trend shows that call activity is down 18%, although average call duration increased by 1 minute.
Best Time to Connect
Wednesday 12pm – 2pm
This time window is when recruiters have the **highest number of actual, meaningful conversations** (calls lasting over 1 minute).
Targeting this window for critical candidate or client outreach maximizes the likelihood of a direct connection, accelerating progress in the recruitment cycle.
If recruiters have high call volumes but low connect rates, managers should coach recruiters and ensure call blocks are being executed within the correct time window to maximize efforts.
Meeting Activity (Scheduled Virtual Meetings)
Average Meetings per Week
9
Average Meeting Time per Week
2hr 50min
Meetings, from client intake calls to internal strategy sessions, are often critical to the recruitment process.
The number and duration of meetings help determine whether recruiters effectively collaborate and engage with internal and external stakeholders.
The QoQ trend shows that the decrease in call activity resulted in more Meeting activity, with an increase in the number of weekly meetings.
Email Activity
Average Emails per Week
74
Email volume is a key indicator of communication and outreach. It shows how actively recruiters correspond with candidates, clients, and internal teams.
A lower-than-benchmark email count may indicate missed opportunities to follow up with leads or maintain candidate pipelines.
Email volume jumped 35%, suggesting that recruiters relied more heavily on email in Q4, which aligns with the drop in call activity.
Tool Adoption
Technology is only impactful when adopted by your team
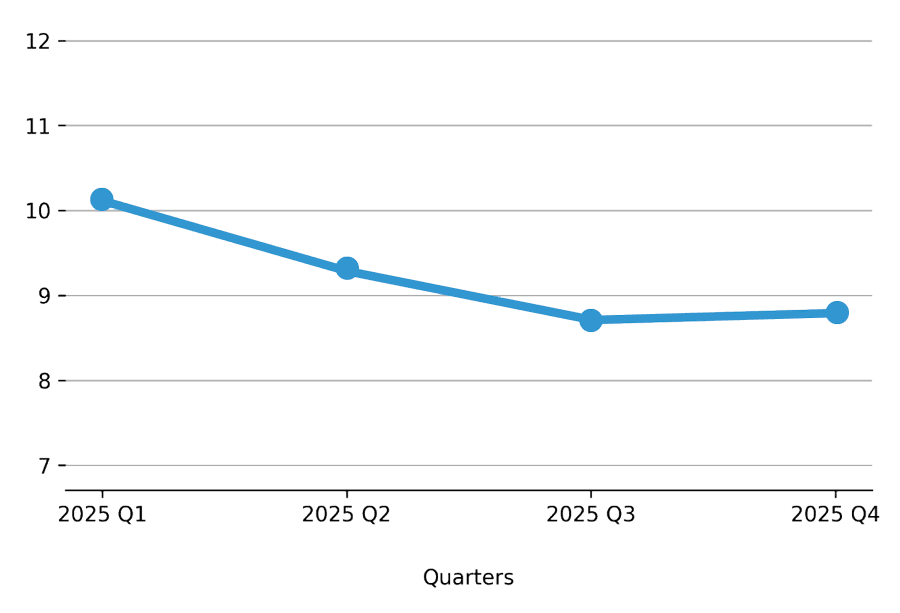
AI Assistant Tools
Avg # AI Tools Used
1
Daily Avg AI Usage
8 min
Time spent on AI tools is up 9X since the start of 2024. Some of the AI assistants favored by Recruiters include ChatGPT, Gemini (Google) and Seamless.ai.
The increase in AI usage is helping recruiters with the number of emails and calls, even when the average active time is down QoQ.
Job Boards
Avg # Job Boards Used
2
Daily Avg AI Usage
24 min
Job Board usage is trending downward, suggesting that AI tools and new ATS capabilities are reducing reliance on job boards to find ideal candidates.
LinkedIn and Indeed remain the top job boards for recruiters.
Find out how your organization compares