The CFO Visibility Gap
Why the largest controllable cost on the P&L is planned on the least current data, and how finance can put evidence behind every workforce and AI decision.
Your largest cost is your least measured one.
Finance is being asked to fund AI, hold headcount flat, and prove that both worked. Hiring requests, AI budgets, software renewals, and restructuring plans are landing on the CFO’s desk at the same time, and each one rests on an assumption about how much work people are doing and where it happens.
Ask what the company spent on AI last year and finance can produce a number. Ask what that spend changed and the room goes quiet. The headcount model shows what the company pays for and the general ledger shows what it spent, but neither shows what changed in the work after the money went out.
of CEOs plan to increase AI investment in 2026, and only 1% expect to cut it.
EY-Parthenon CEO Outlook, May 2026
of CEOs say AI greatly exceeded their expectations over the past year.
EY-Parthenon CEO Outlook, Jan 2026
of the time AI saves is lost to correcting, rewriting, and verifying its output.
Workday survey, via CNBC, Apr 2026
When AI arrived as a pilot it had an owner, a budget, and a place on the P&L. Today it enters through at least five channels, so the cost figure most companies report is incomplete before anyone asks about return.
Embedded features
AI built into platforms the company already licenses
Added seats
AI tiers and add-ons layered onto existing contracts
Cloud consumption
Usage-based model and API costs inside the cloud bill
Team subscriptions
Tools expensed by teams with little central review
People
Staff hired under other titles who now spend much of their week on AI work
Every one of these decisions is currently being made on the plan, not on the reality.
The plan vs. what’s actually happening
Finance can almost always say what a function costs and can rarely say what it produces, because cost data is structured and output data is not. AI has widened that gap in the fastest-growing category on the technology budget. Plans still treat the full-time employee as the unit of work, even as work moves across people, software, and AI in ways the FTE count cannot show.
Spend shows the size of the bet. Activity shows how it’s playing out.
How work becomes a planning input.
AI does not live in one tool, so the evidence of its impact does not either. A drop in one application may mean the workflow moved to another, and a team that looks slow to adopt may be using tools outside the approved stack. Prodoscore reads those footprints together. It connects through APIs to the tools the workforce already uses, captures activity metadata only, never message or document content, and turns it into a continuous operating signal finance can put next to its own numbers.
| COST LINE | HOW IT’S PRICED | WHAT FINANCE GAINS |
|---|---|---|
|
P
People
Payroll, benefits, and contractors
|
Per FTE, per hour | Utilization and capacity by team, measured continuously |
|
S
AI & software seats
Copilot, Claude, Gemini, and SaaS
|
Per seat, per month | Engagement per seat and output change per team |
|
A
AI agents & services
Autonomous, outcome-priced work
|
Per task, per outcome | Where agent work replaces, or adds to, human work |
8 use cases. 4 finance decisions.
Each use case attaches a continuous, objective signal to a decision finance already owns, so the approval, the forecast, or the board update rests on what the work shows.
Test each request against the team’s sustained workload before approving the requisition, and see whether the gap is real or seasonal.
Find teams with available capacity next to teams under strain, so the first answer to a capacity gap can be redeployment rather than a new hire.
Baseline each team before rollout, then track whether use persists and whether the gain shows up in output or disappears into rework.
See which seats are used, which tools heavy AI users stop relying on, and where unsanctioned AI is filling gaps in the approved stack.
Before a reduction is approved, identify the roles that connect teams and hold institutional knowledge, which rarely show on the org chart.
Compare collaboration and workload before and after a reorganization to confirm the new structure delivered what the business case promised.
Feed real utilization into the planning model so capacity drivers come from observed work rather than historical ratios and manager estimates.
Show boards, audit committees, and clients a before-and-after comparison of how work changed, instead of reports that the work feels faster.
The AI savings in your plan may not exist yet.
AI was supposed to give people time back. For many teams the hours go into checking output, rewriting drafts, and taking on broader scope instead. Finance teams feel this directly: in Datarails’ 2026 CFO Sentiments survey, 96% of finance teams said they spend at least 10% of their workday verifying AI output. A headcount plan that books AI savings at rollout is booking capacity nobody has measured.
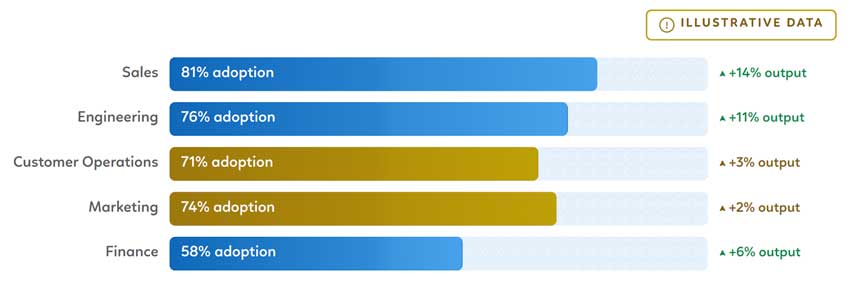
The annual plan assumed AI would free 12% of capacity in a 120-person Customer Operations group, which let the company hold 14.4 open roles unfilled. Ninety days after rollout, adoption was high at 71%, but output per person was up only 3% against each employee’s own pre-rollout baseline, and after-hours work had risen. Realized capacity covered 3.6 roles, not 14.4. Finance re-forecast in the first quarter, funded targeted workflow fixes, and phased six hires into the second half instead of discovering the shortfall in a year-end variance.
FTE gap between assumed and realized AI capacity
Plan exposure surfaced, at $85K average loaded cost per role
When the gap was found, instead of the yearend close
The pilot was never the hard part.
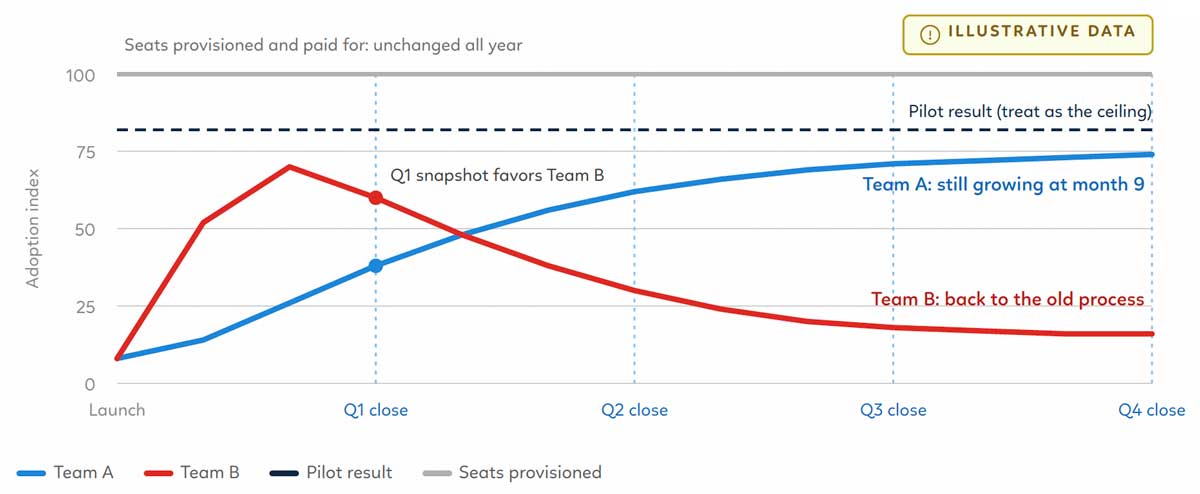
Pilots tend to succeed under conditions that do not survive a company-wide rollout. The team is hand-picked, motivated, and aware that leadership is watching. At scale, the tool reaches people who did not volunteer and already have a working way to do the job. Use spikes during the novelty period, then the people who drift back to their old process do so quietly. The license stays active, so nothing in the spend data changes.
This is where most AI business cases break down, and it rarely gets caught because no one is measuring behavior once the launch is announced. Finance ends up funding the expansion on pilot economics that were never going to repeat at scale.
Three disciplines finance already applies.
Closing the gap between spend and evidence does not need a new valuation model. It needs the same disciplines finance applies to capital projects and to any program with a payback period. AI has been given an exemption it does not need.
Record the starting point before deployment
Capture how long the process takes today, how many passes it needs, and how much that varies across the team. Measure the same things afterward.
Measure adoption after launch, not at launch
Treat the pilot as the ceiling and measure how far the rollout falls from it. Use that is still growing at month nine, without a mandate behind it, is the clearest early sign of real change.
Fund the functions where use compounds
Visible, customer-facing projects attract budget because they demo well. Durable gains often build in finance and operations, where work is repetitive and well defined.
| MEASURE | BEFORE ROLLOUT | MONTH 9 | WHAT IT TELLS FINANCE |
|---|---|---|---|
| Cycle time per exception | 2.6 days | 1.4 days | 46% faster, and holding |
| Touches per item | 3.4 | 2.1 | Less rework, fewer handoffs |
| Spread, slowest vs. fastest quartile | 3.1× | 1.6× | Gains reached the whole team |
| Share of team using AI weekly | 0% | 86% | Persistent without a mandate |
Test the hire before you approve it.
Most hiring requests reach finance with a strong argument and no independent evidence. A team that is genuinely overloaded and a team having a busy month look the same on a requisition form. Sustained utilization data separates them, and it shows where capacity is available elsewhere in the business, so reallocation can be weighed before new spend.
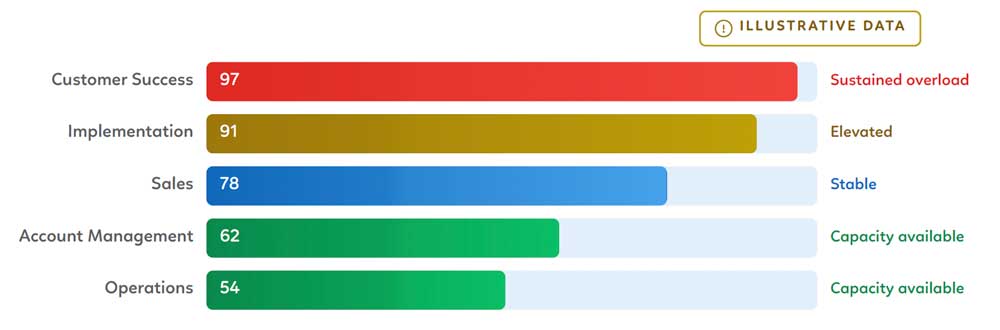
Mid-year, finance received seven new requisitions from four teams, at an average loaded cost of $105K per role. Customer Success had run above 90 on the capacity index for eleven straight weeks, so its three requests were approved immediately. Implementation’s two requests were met by redeploying two people from Account Management, where utilization had sat in the low 60s since a product consolidation. The remaining two requests were deferred to the next planning cycle with a clear threshold for reopening them.
Requisitions approved, each with utilization evidence attached
Annualized spend avoided through redeployment and deferral
Sustained overload documented before the approval
A reduction that works in the model can still break the business.
Restructuring decisions are usually built from the org chart, which is the least accurate map of how a company runs. In every organization a small number of people connect teams, carry institutional knowledge, and keep work moving across departments. Their titles rarely show it, which is why their roles so often look redundant in a cost model. Cutting one of them can remove more capacity than the line item suggests.
Collaboration network analysis, built from meeting, email, and chat metadata the company already generates, shows that hidden structure at the team and role level before the decision is final.
| ROLE GROUP IN SCOPE | PLANNED CUT | WHAT THE NETWORK SHOWS | RISK | DECISION |
|---|---|---|---|---|
| Regional Ops Coordinators | Planned Cut:6 of 14 | What the network shows:Sit on the main handoff path between Sales, Fulfillment, and Billing in three regions | Risk:High | Decision:Cut 2, redeploy 2, hold 2 |
| Finance Analysts, Shared Services | Planned Cut:4 of 18 | What the network shows:Two analysts are the only regular link between FP&A and procurement | Risk:Medium | Decision:Cut 4, transfer knowledge first |
| Marketing Specialists | Planned Cut:5 of 22 | What the network shows:Work is concentrated in tools that heavy AI users have largely stopped using | Risk:Low | Decision:Proceed as planned |
| IT Service Desk, Tier 1 | Planned Cut:8 of 30 | What the network shows:Ticket volume already shifting to an agent; collaboration is contained within the team | Risk:Low | Decision:Proceed, phased over two quarters |
You can count licenses. Can you count usage?
Most organizations can say which AI and software tools they bought. Very few can show that those tools changed how people work. Usage volume is no help on its own, because two people can consume the same AI capacity and get entirely different results.
Seat A · $30 per month
Built the assistant into the weekly close. A reconciliation that took a full day now takes about an hour.
Seat B · $30 per month
Opened the tool twice in the first month, asked a few questions, and has not returned.
Systems of record hold the plan. This layer holds the reality.
HCM systems know who your people are and what they cost. Planning tools model what the workforce should look like. Neither can show how work actually flows inside the organization on a given day. Prodoscore provides that behavioral layer and feeds it into the systems finance already trusts.
Observed, Not Estimated
Capacity drivers come from how people actually use their tools, not from historical ratios, surveys, or manager estimates.
Continuous, Not Quarterly
The signal updates as work changes, so AI and restructuring outcomes show up as a trend rather than a single quarter-close snapshot.
Additive to Your Stack
Works alongside Workday, SAP, UKG, and your planning and BI tools through the Data API and MCP Connector.
Governed by Design
Metadata only, aggregate views first, rolebased access, and configurable anonymization. SOC 2 Type 2, AES-256 encryption, and SSO through SAML 2.0.
Fast to Evidence
API integrations go live in days with minimal IT lift, and most organizations reach their first decision-ready insight in about two weeks.
ROI You Can Audit
Customers see an average 20% productivity increase within four months, measured against their own baseline in the platform.
From a financial standpoint, we’ve seen real wins. We onboarded two new hires and after 60 days I suspected they weren’t performing, but I didn’t want to rely on gut instinct alone. Prodoscore gave me clear, objective evidence to act on.
Put a baseline under the next decision before the money moves.
What AI changed sounds like an accounting question. It is really an observation question, and it can only be answered if the measurement starts before the spend does. Prodoscore offers a proof-of-value engagement scoped to one decision already on your calendar, whether a hiring plan, an AI renewal, or a restructuring case. We baseline the teams involved, track what changes, and give finance evidence it can take to the ELT and the board.
Decision on your calendar, scoped and measured end to end
Typical time to first decision-ready insight
Average productivity increase customers see within four months